
[notes] A single-cell count data simulator with correlations captured
scDesign2: a transparent simulator that generates high-fidelity single-cell gene expression count data with gene correlations captured
Intro
Multiple algorithms are available for different single-cell RNA sequencing (scRNA-seq) tasks, including gene expression imputation, dimensionality reduction, cell clustering, and more. However, benchmark studies often evaluate only a fraction of these methods using particular experimental data, which restricts their suitability for various research requirements. As a result, single-cell researchers face challenges in adopting a systematic and flexible approach.
A possible remedy is to use synthetic datasets, which offer known ground truths like cell types and differentially expressed genes, without incurring extra experimental expenses. That’s why we want to simulate single-cell count data, and ideally retain all the correlation information from the real datasets.
Benefits
The ideal simulator should have the following key features:
-
Adaptability: It can be trained using real data, making it suitable for various experimental protocols and biological conditions.
-
Gene Preservation: The simulator retains real genes in its synthetic cells, which is important for benchmarking differential gene expression analysis.
-
Gene Correlation: It captures gene correlations, maintaining the gene correlation structure found in real data. This is crucial for benchmarking multi-gene analyses.
-
Varying Data Characteristics: The simulator generates data with varying cell numbers and sequencing depth under the same biological conditions as the training data, aiding experimental design and method robustness assessment.
-
Transparency: The simulator’s model parameters are easily understood and adjustable, allowing for model diagnostics and customized simulations.
-
Efficiency: The simulator is computationally and sample-efficient, making it user-friendly and suitable for a wide range of applications.
Having achieved these six properties, scDesign2 becomes a valuable tool for helping with experimental design and evaluating computational methods for single-cell transcriptomics.
Methods
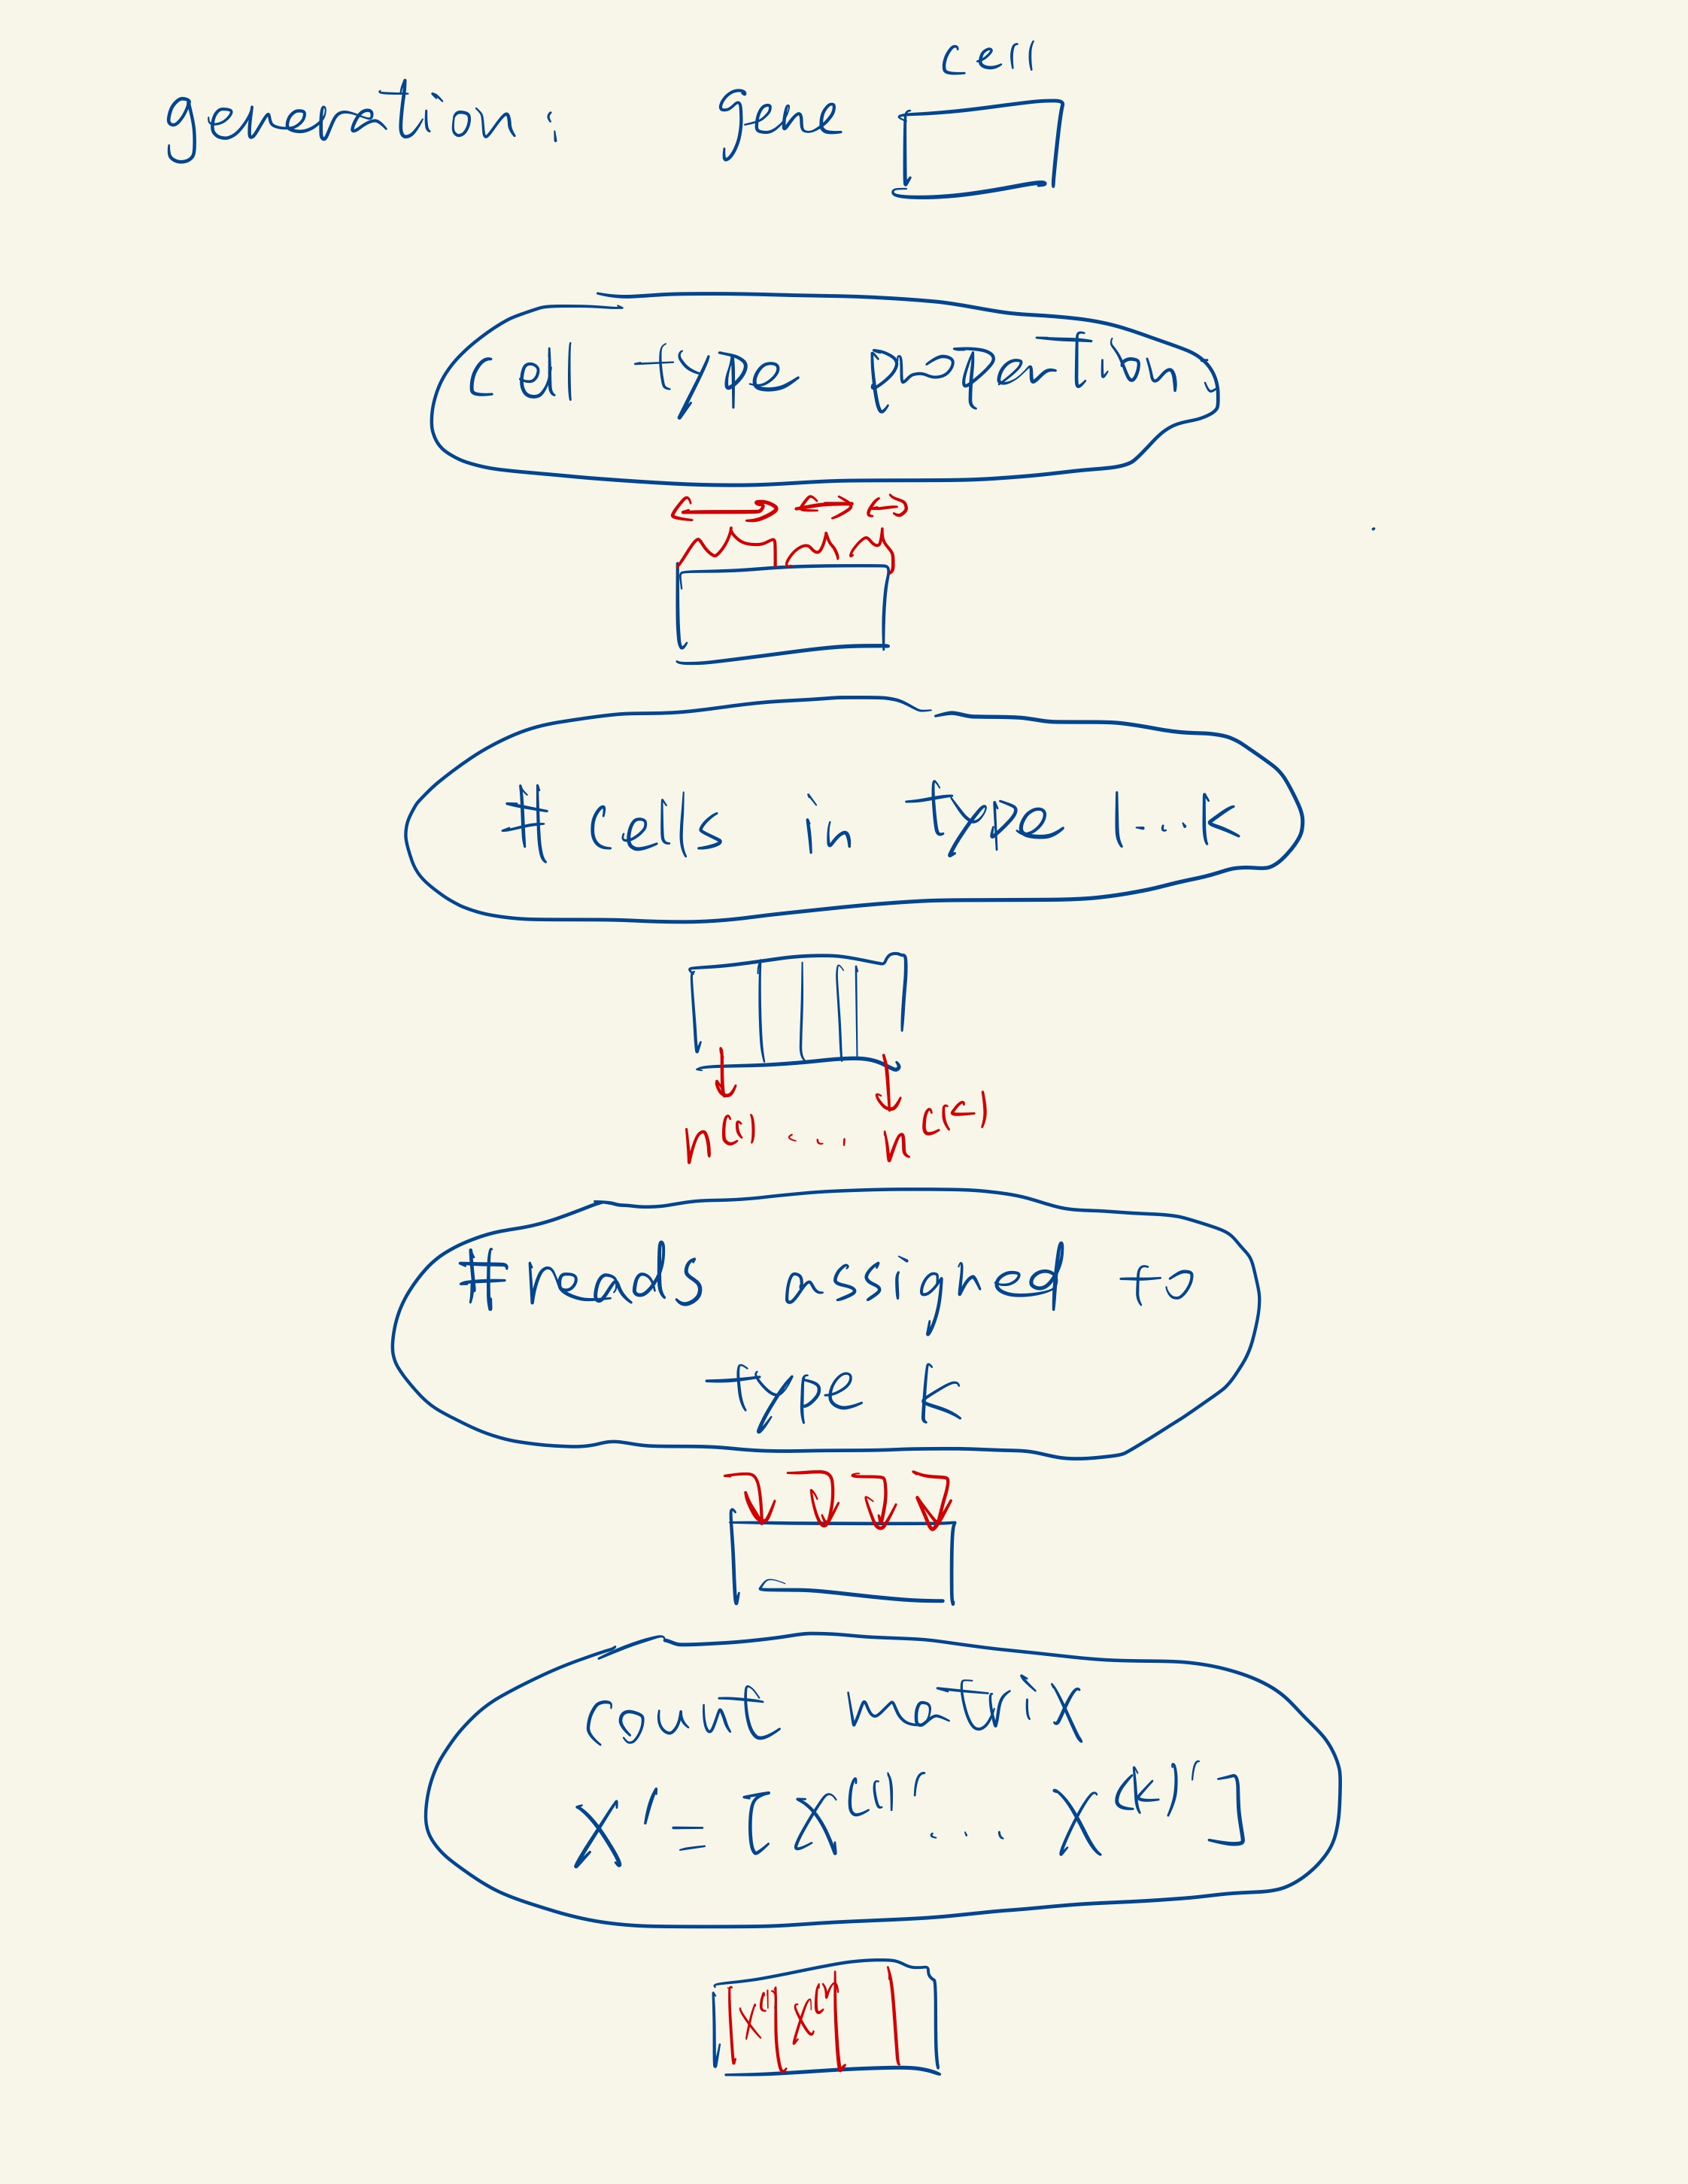
I’ll try to explain its statistical framework with my notes:
For some details mentioned below, check here.
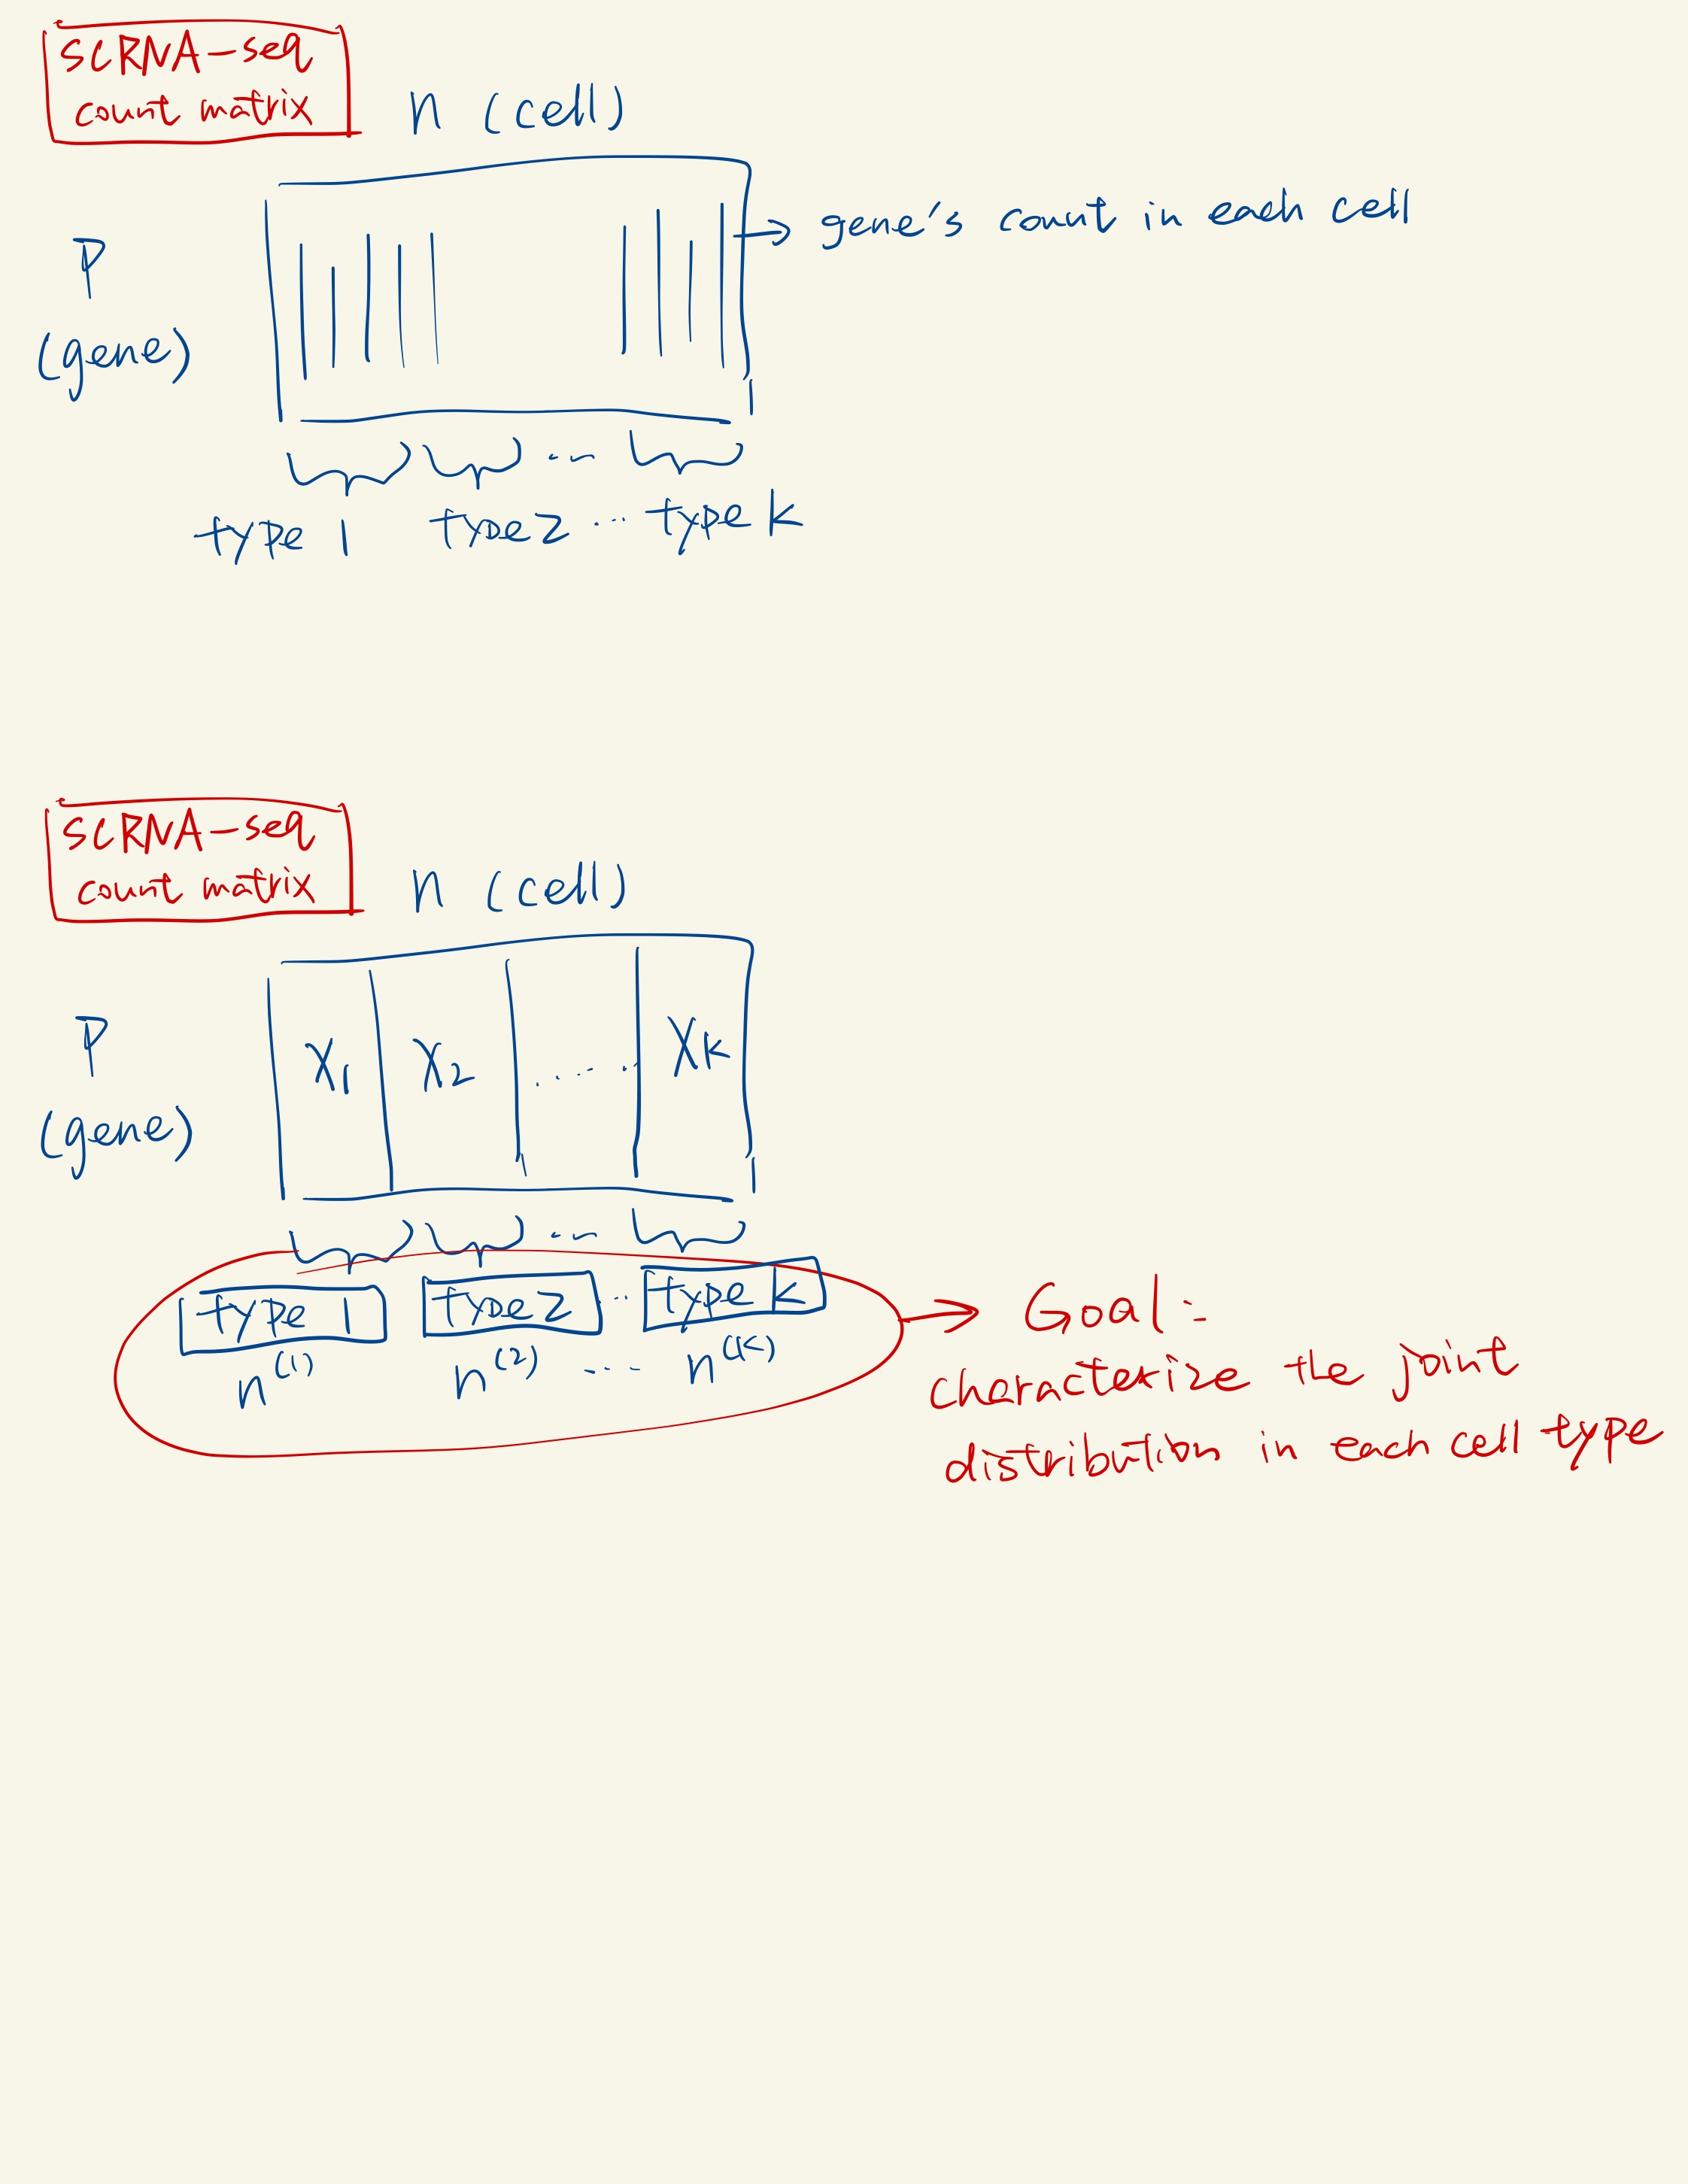
The type is assigned by clustering, labeled by marker genes, or known in advance.
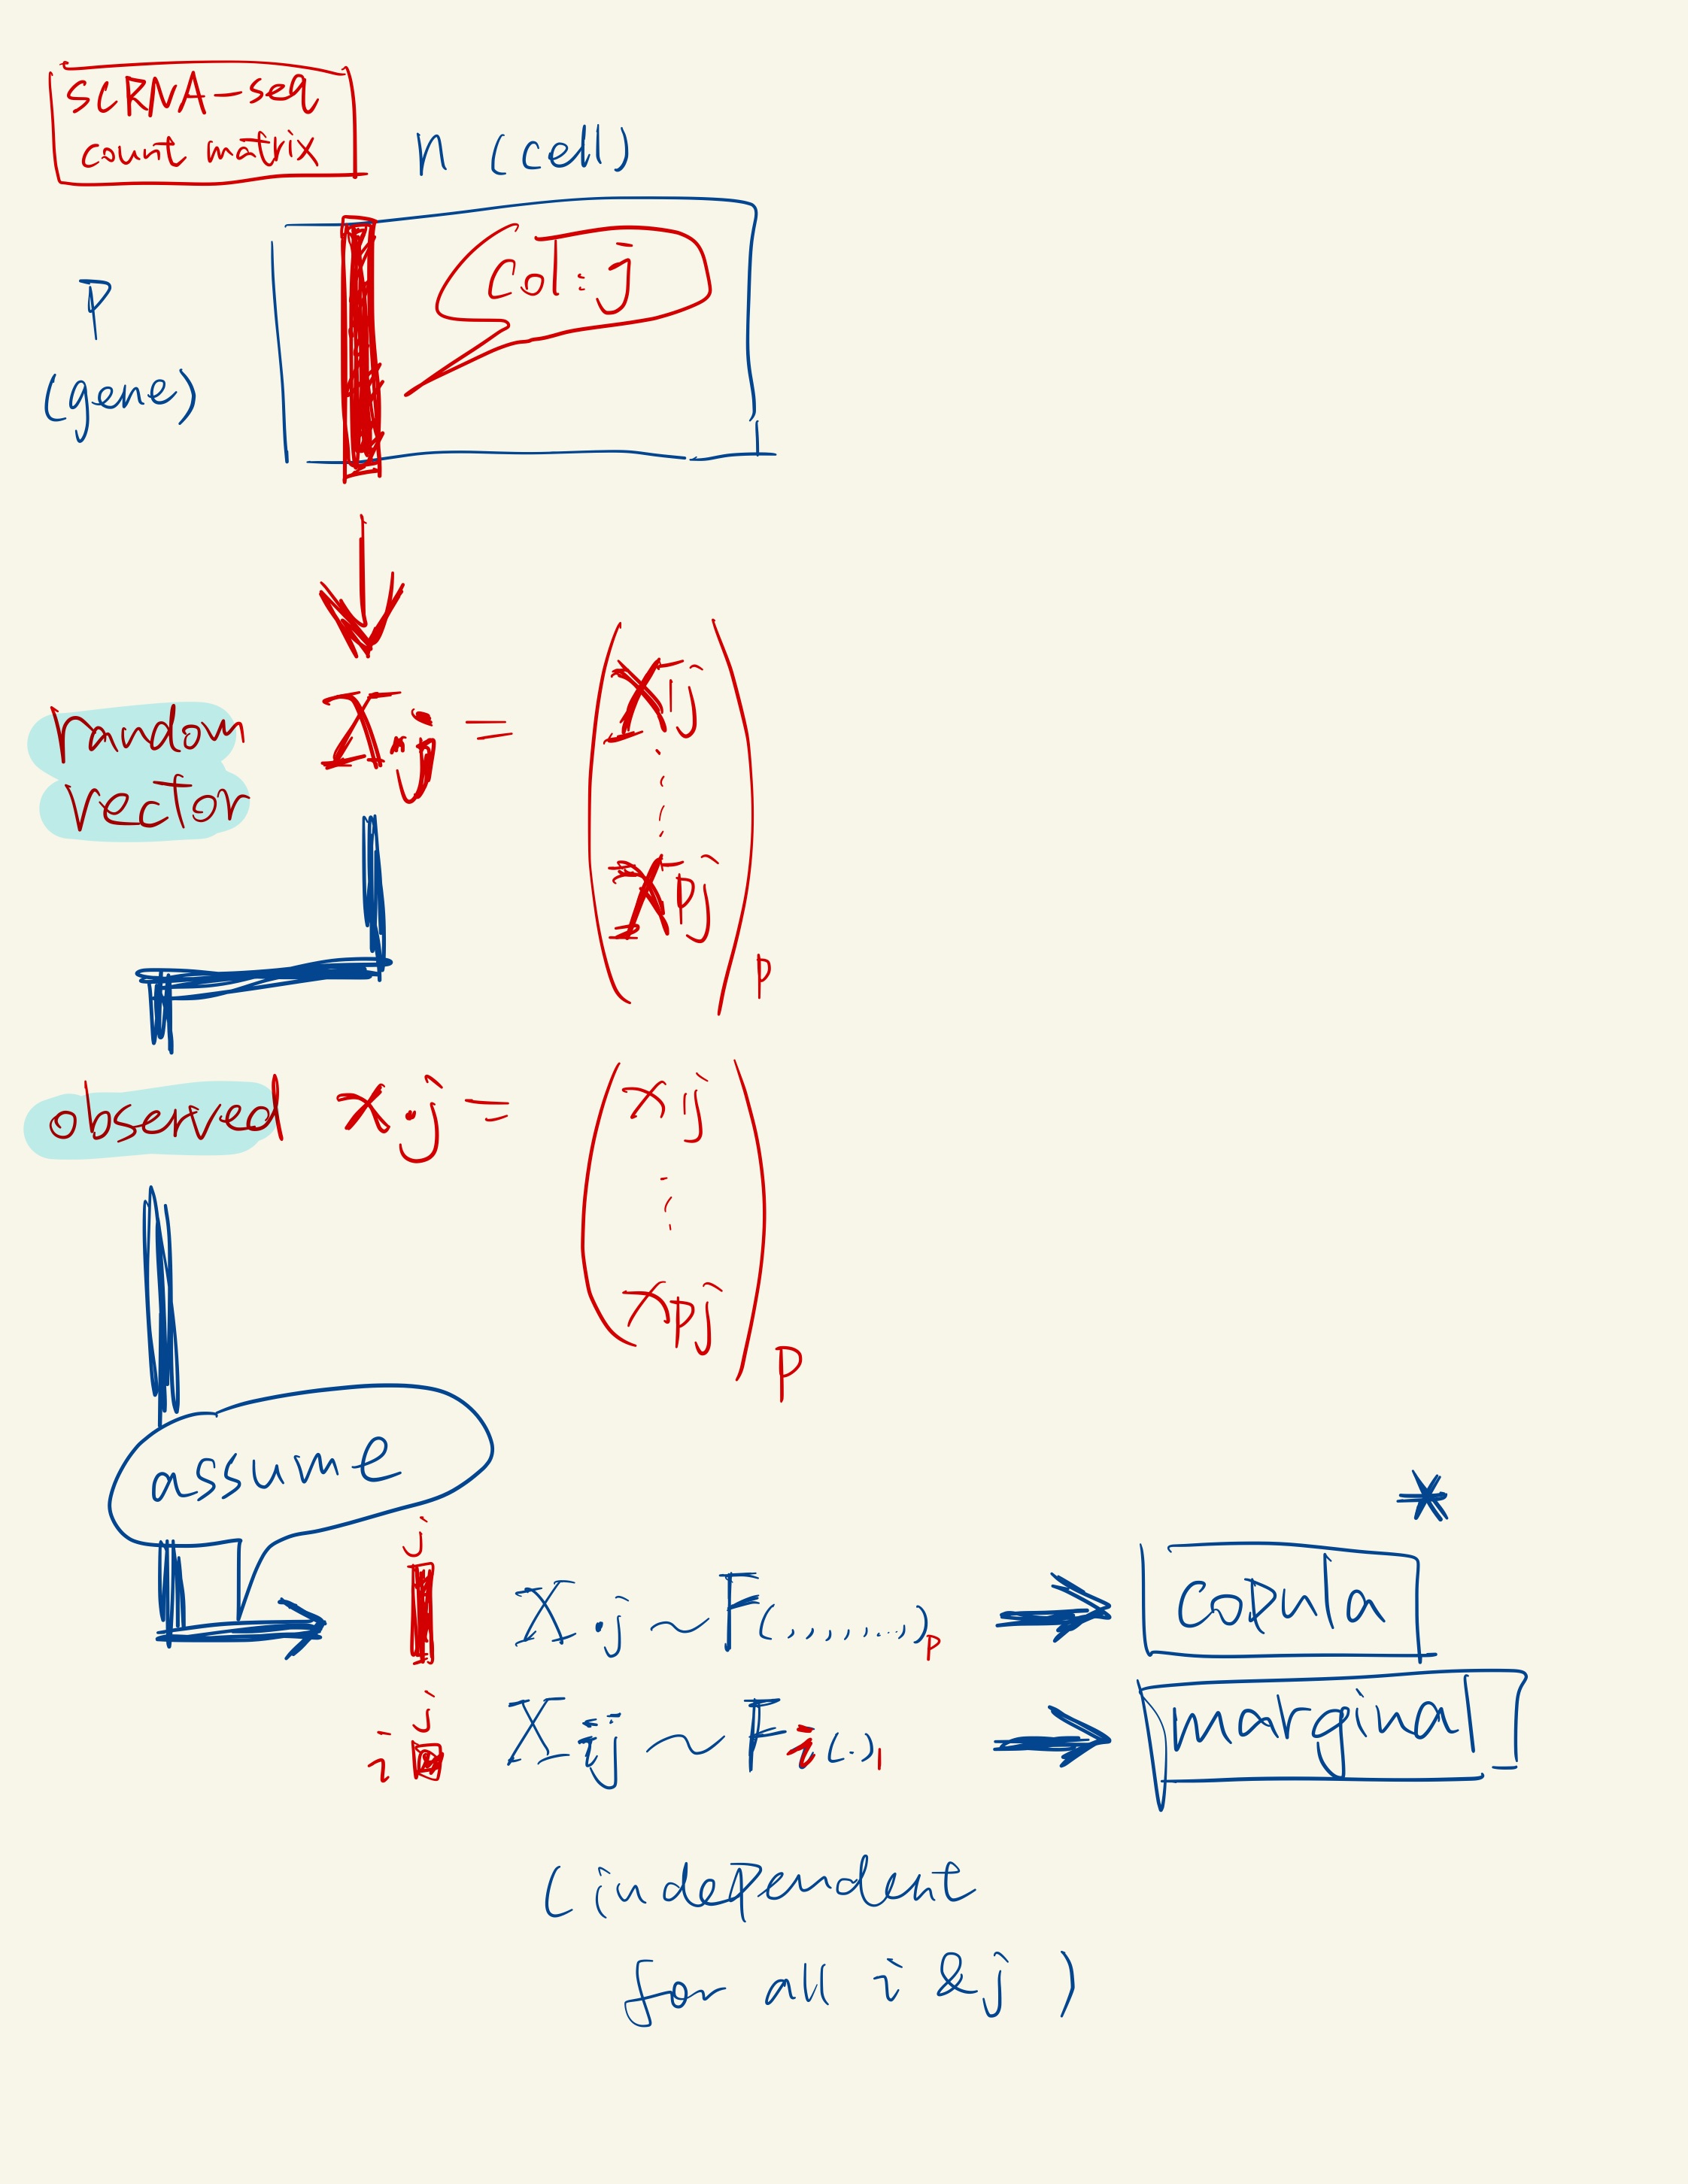
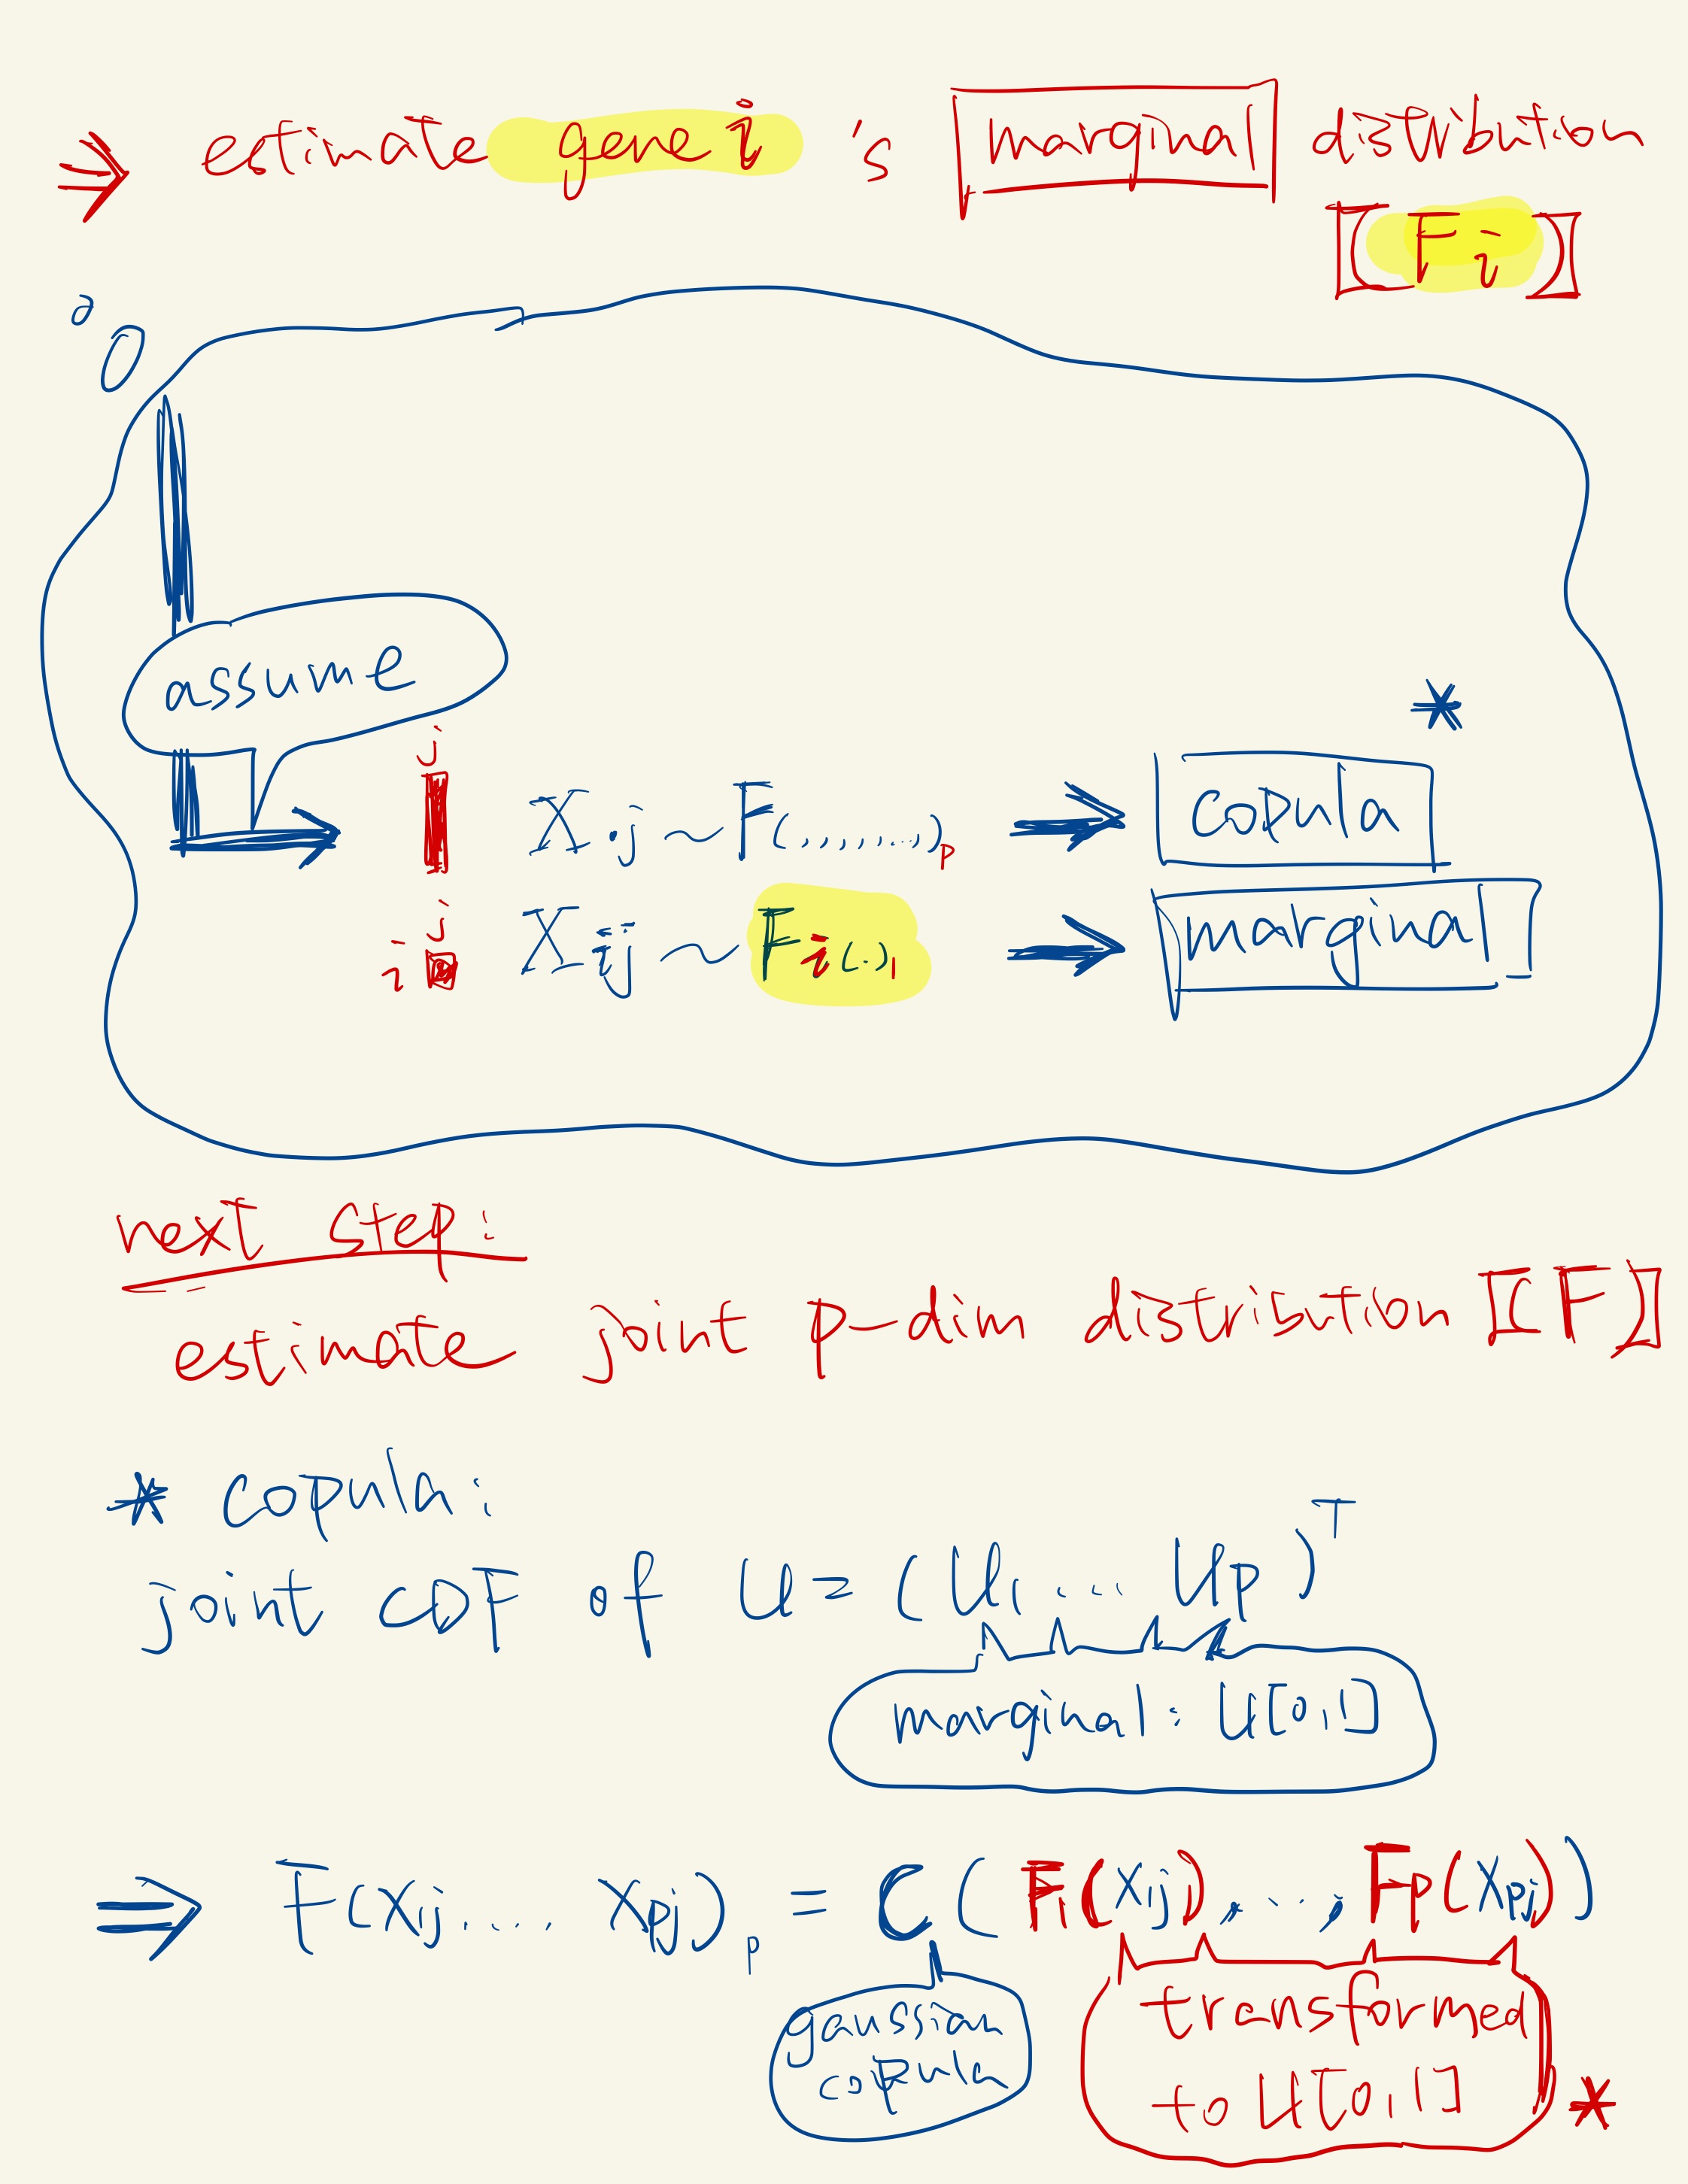
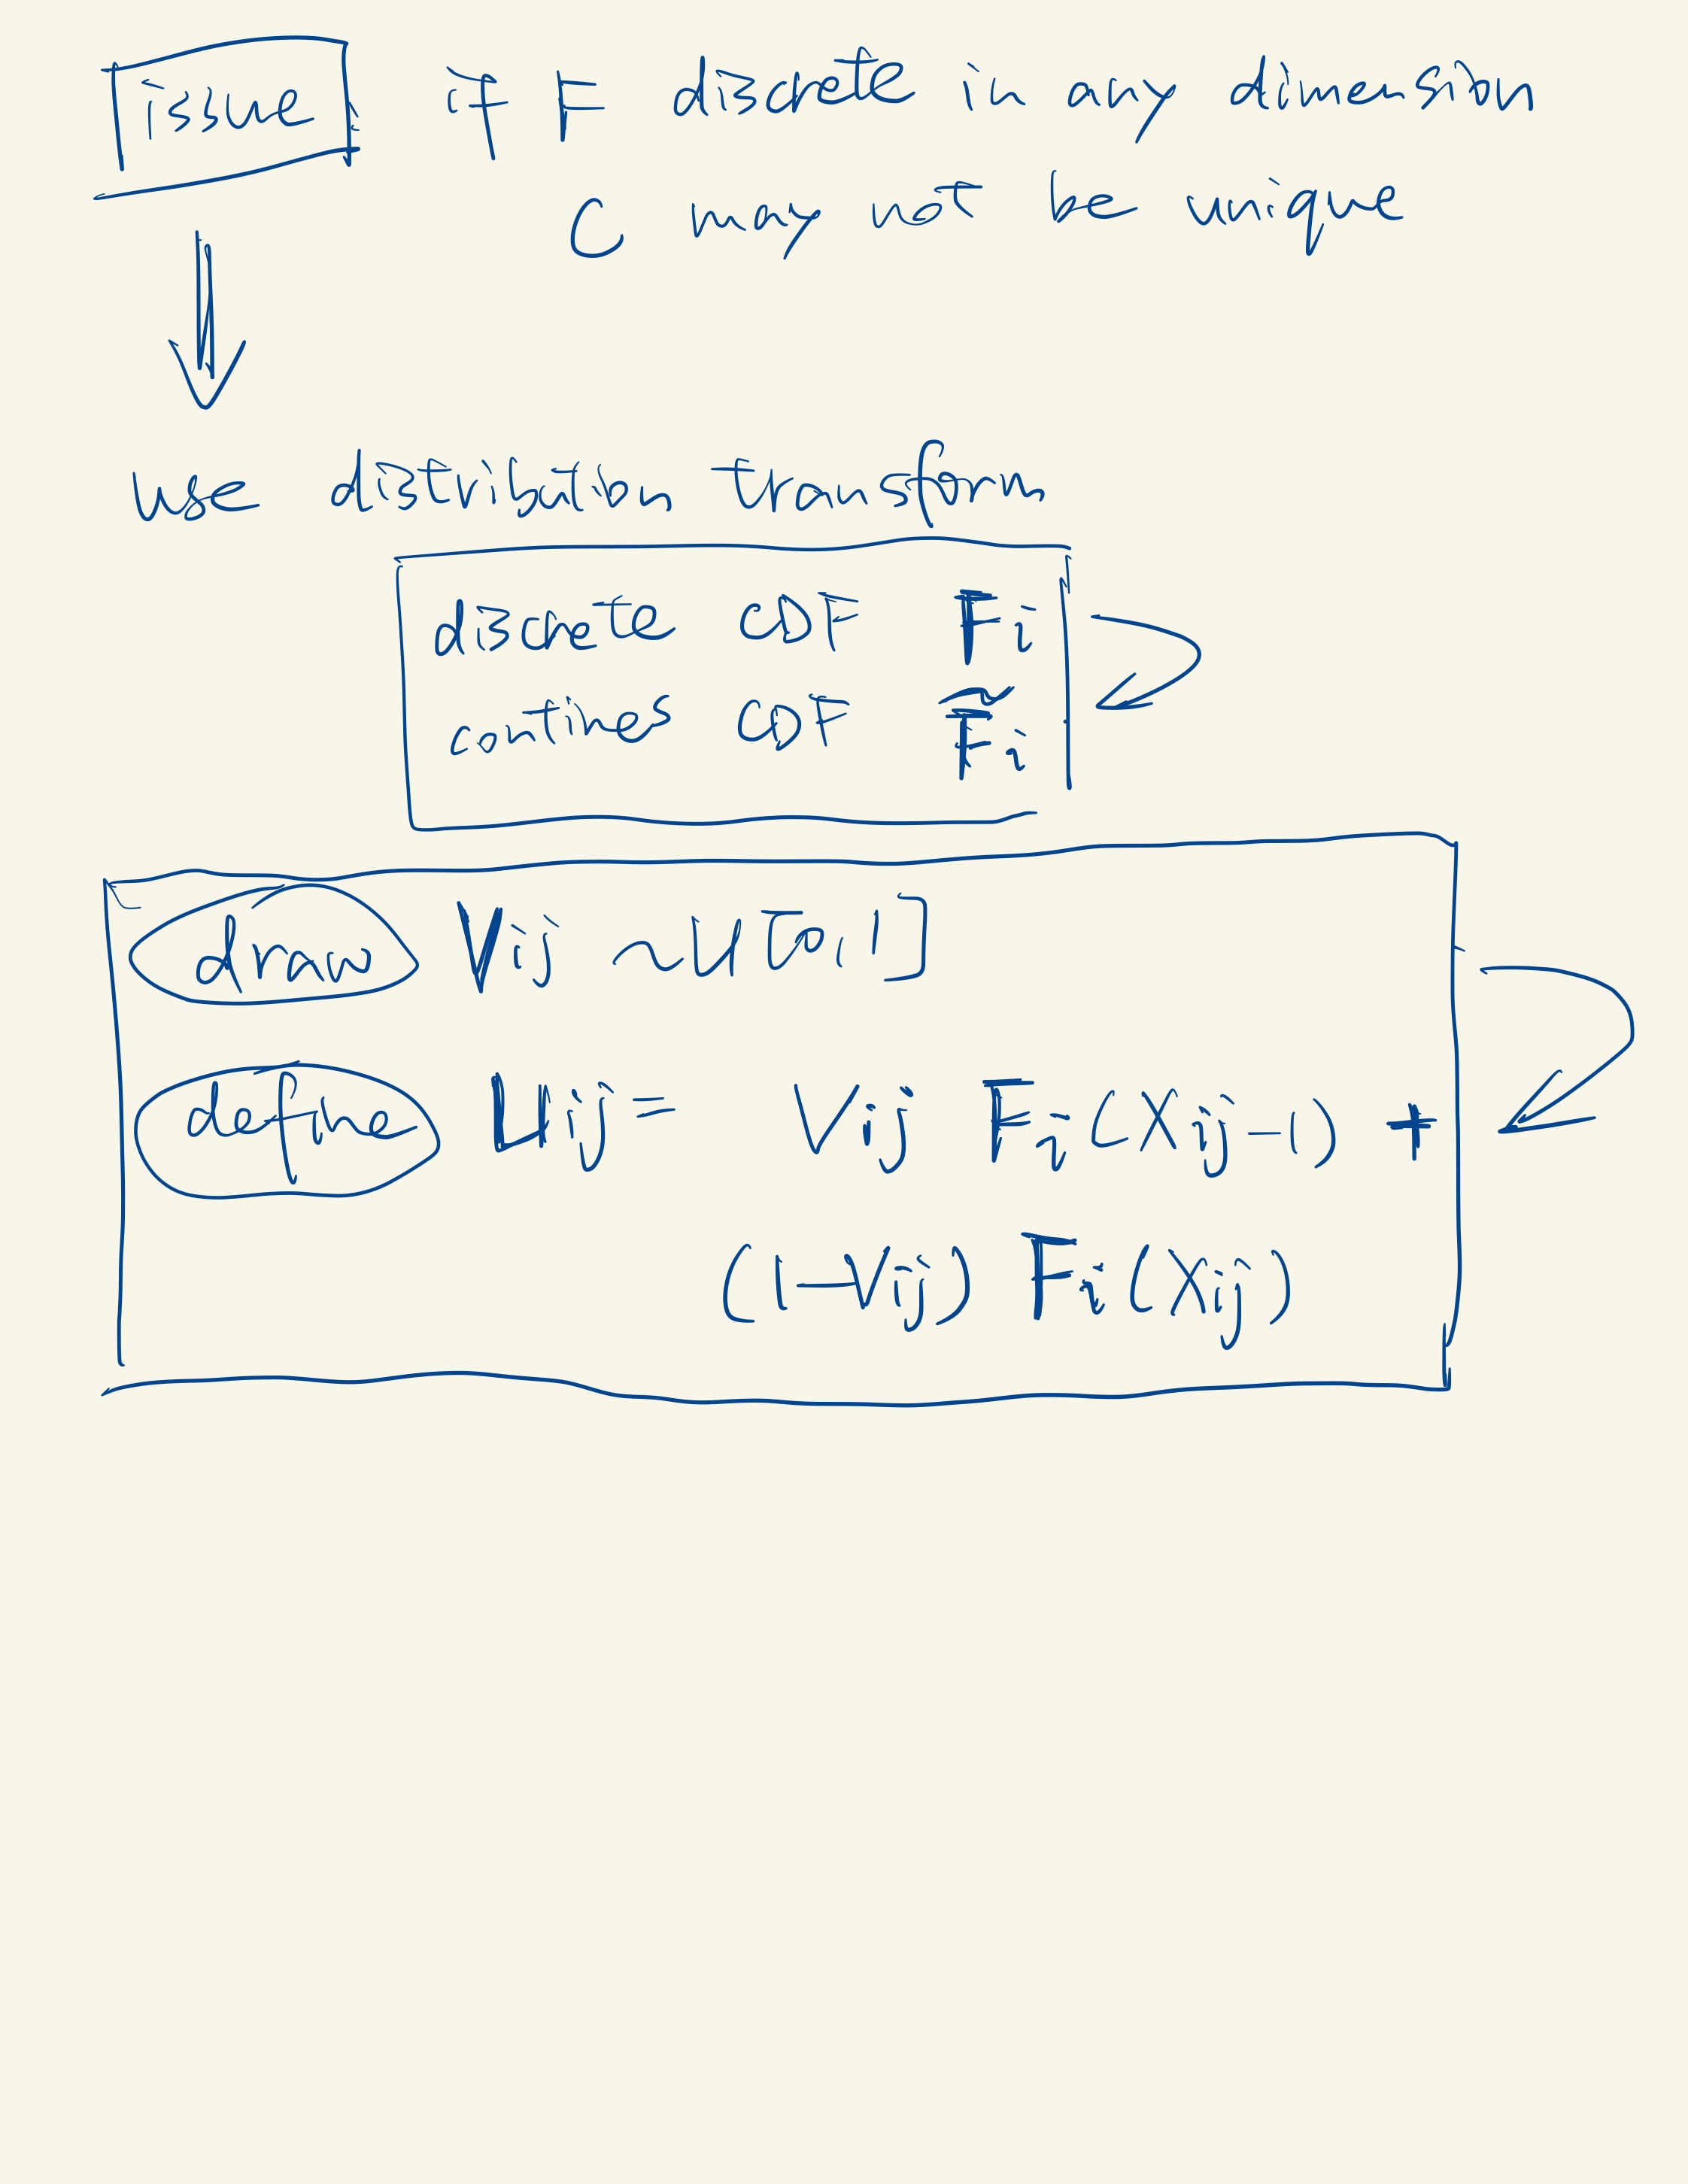
A copula is a multivariate cumulative distribution function for which the marginal probability distribution of each variable is uniform on the interval [0, 1]. Check more details here.
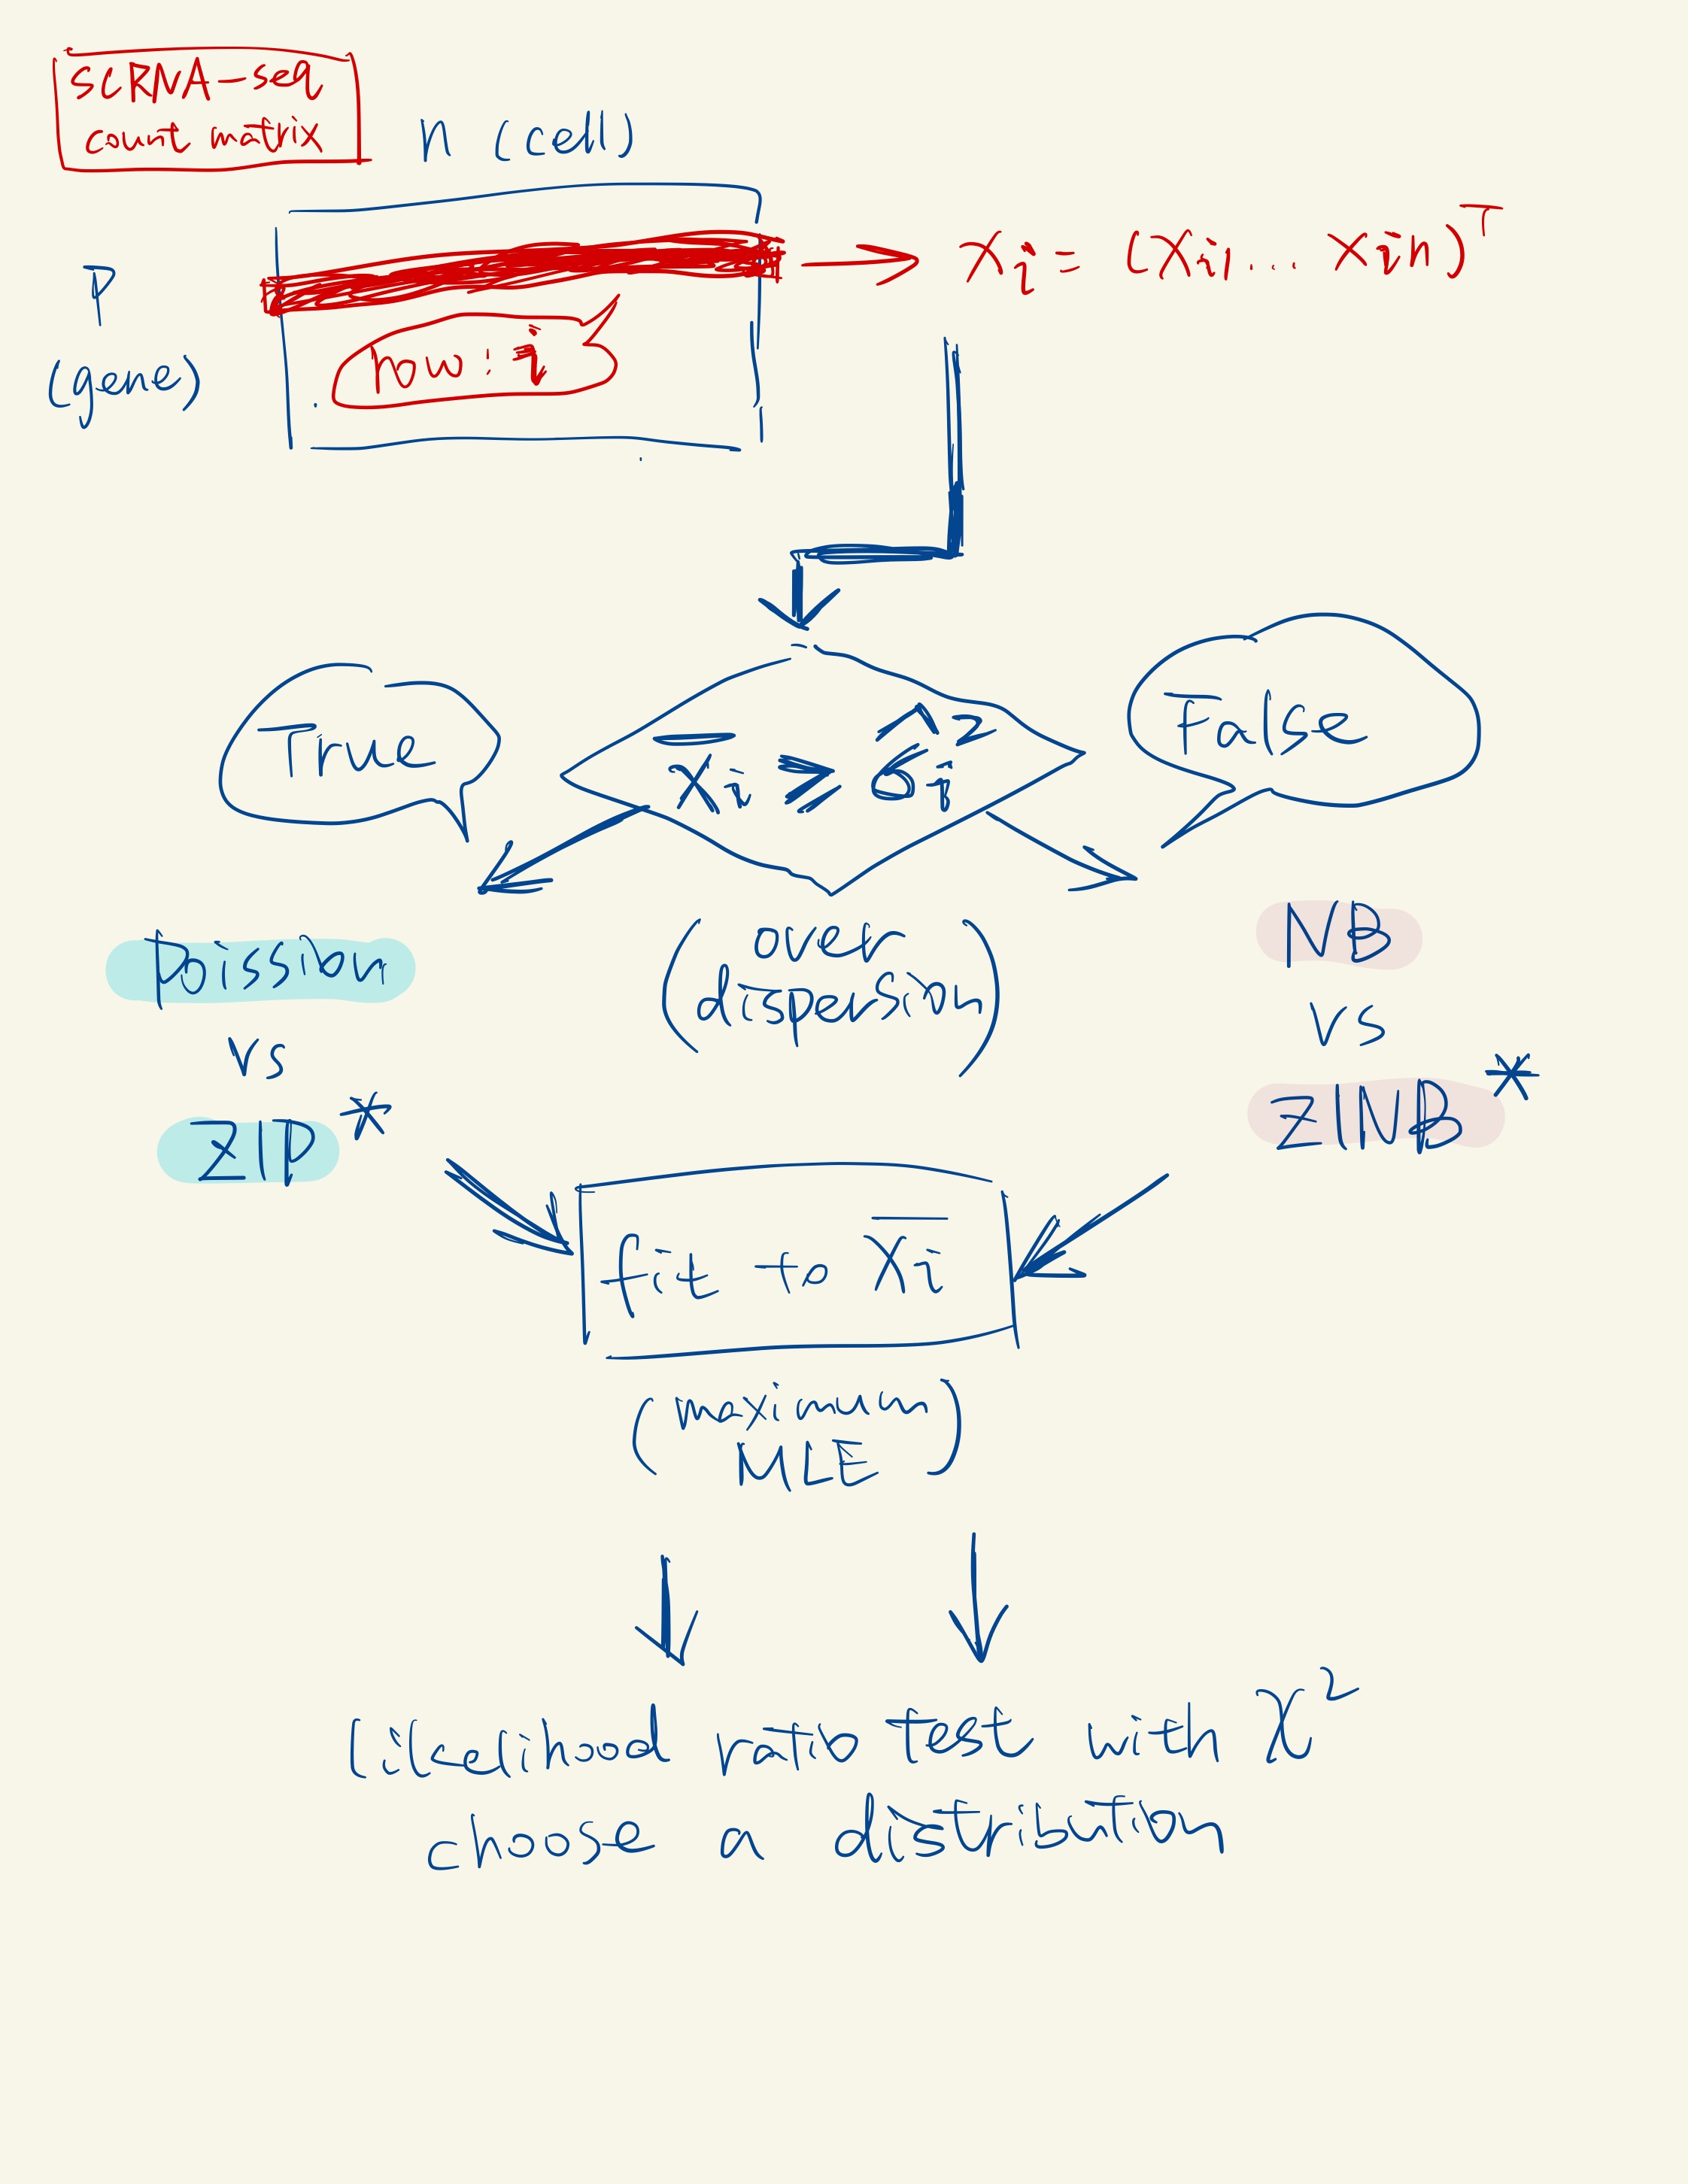
The Poisson, the zero-inflated Poisson (ZIP), and the negative binomial (NB) distributions are three special cases of the ZINB distribution. From these four distributions, scDesign2 automatically chooses the one that best fits to gene’s observed counts.
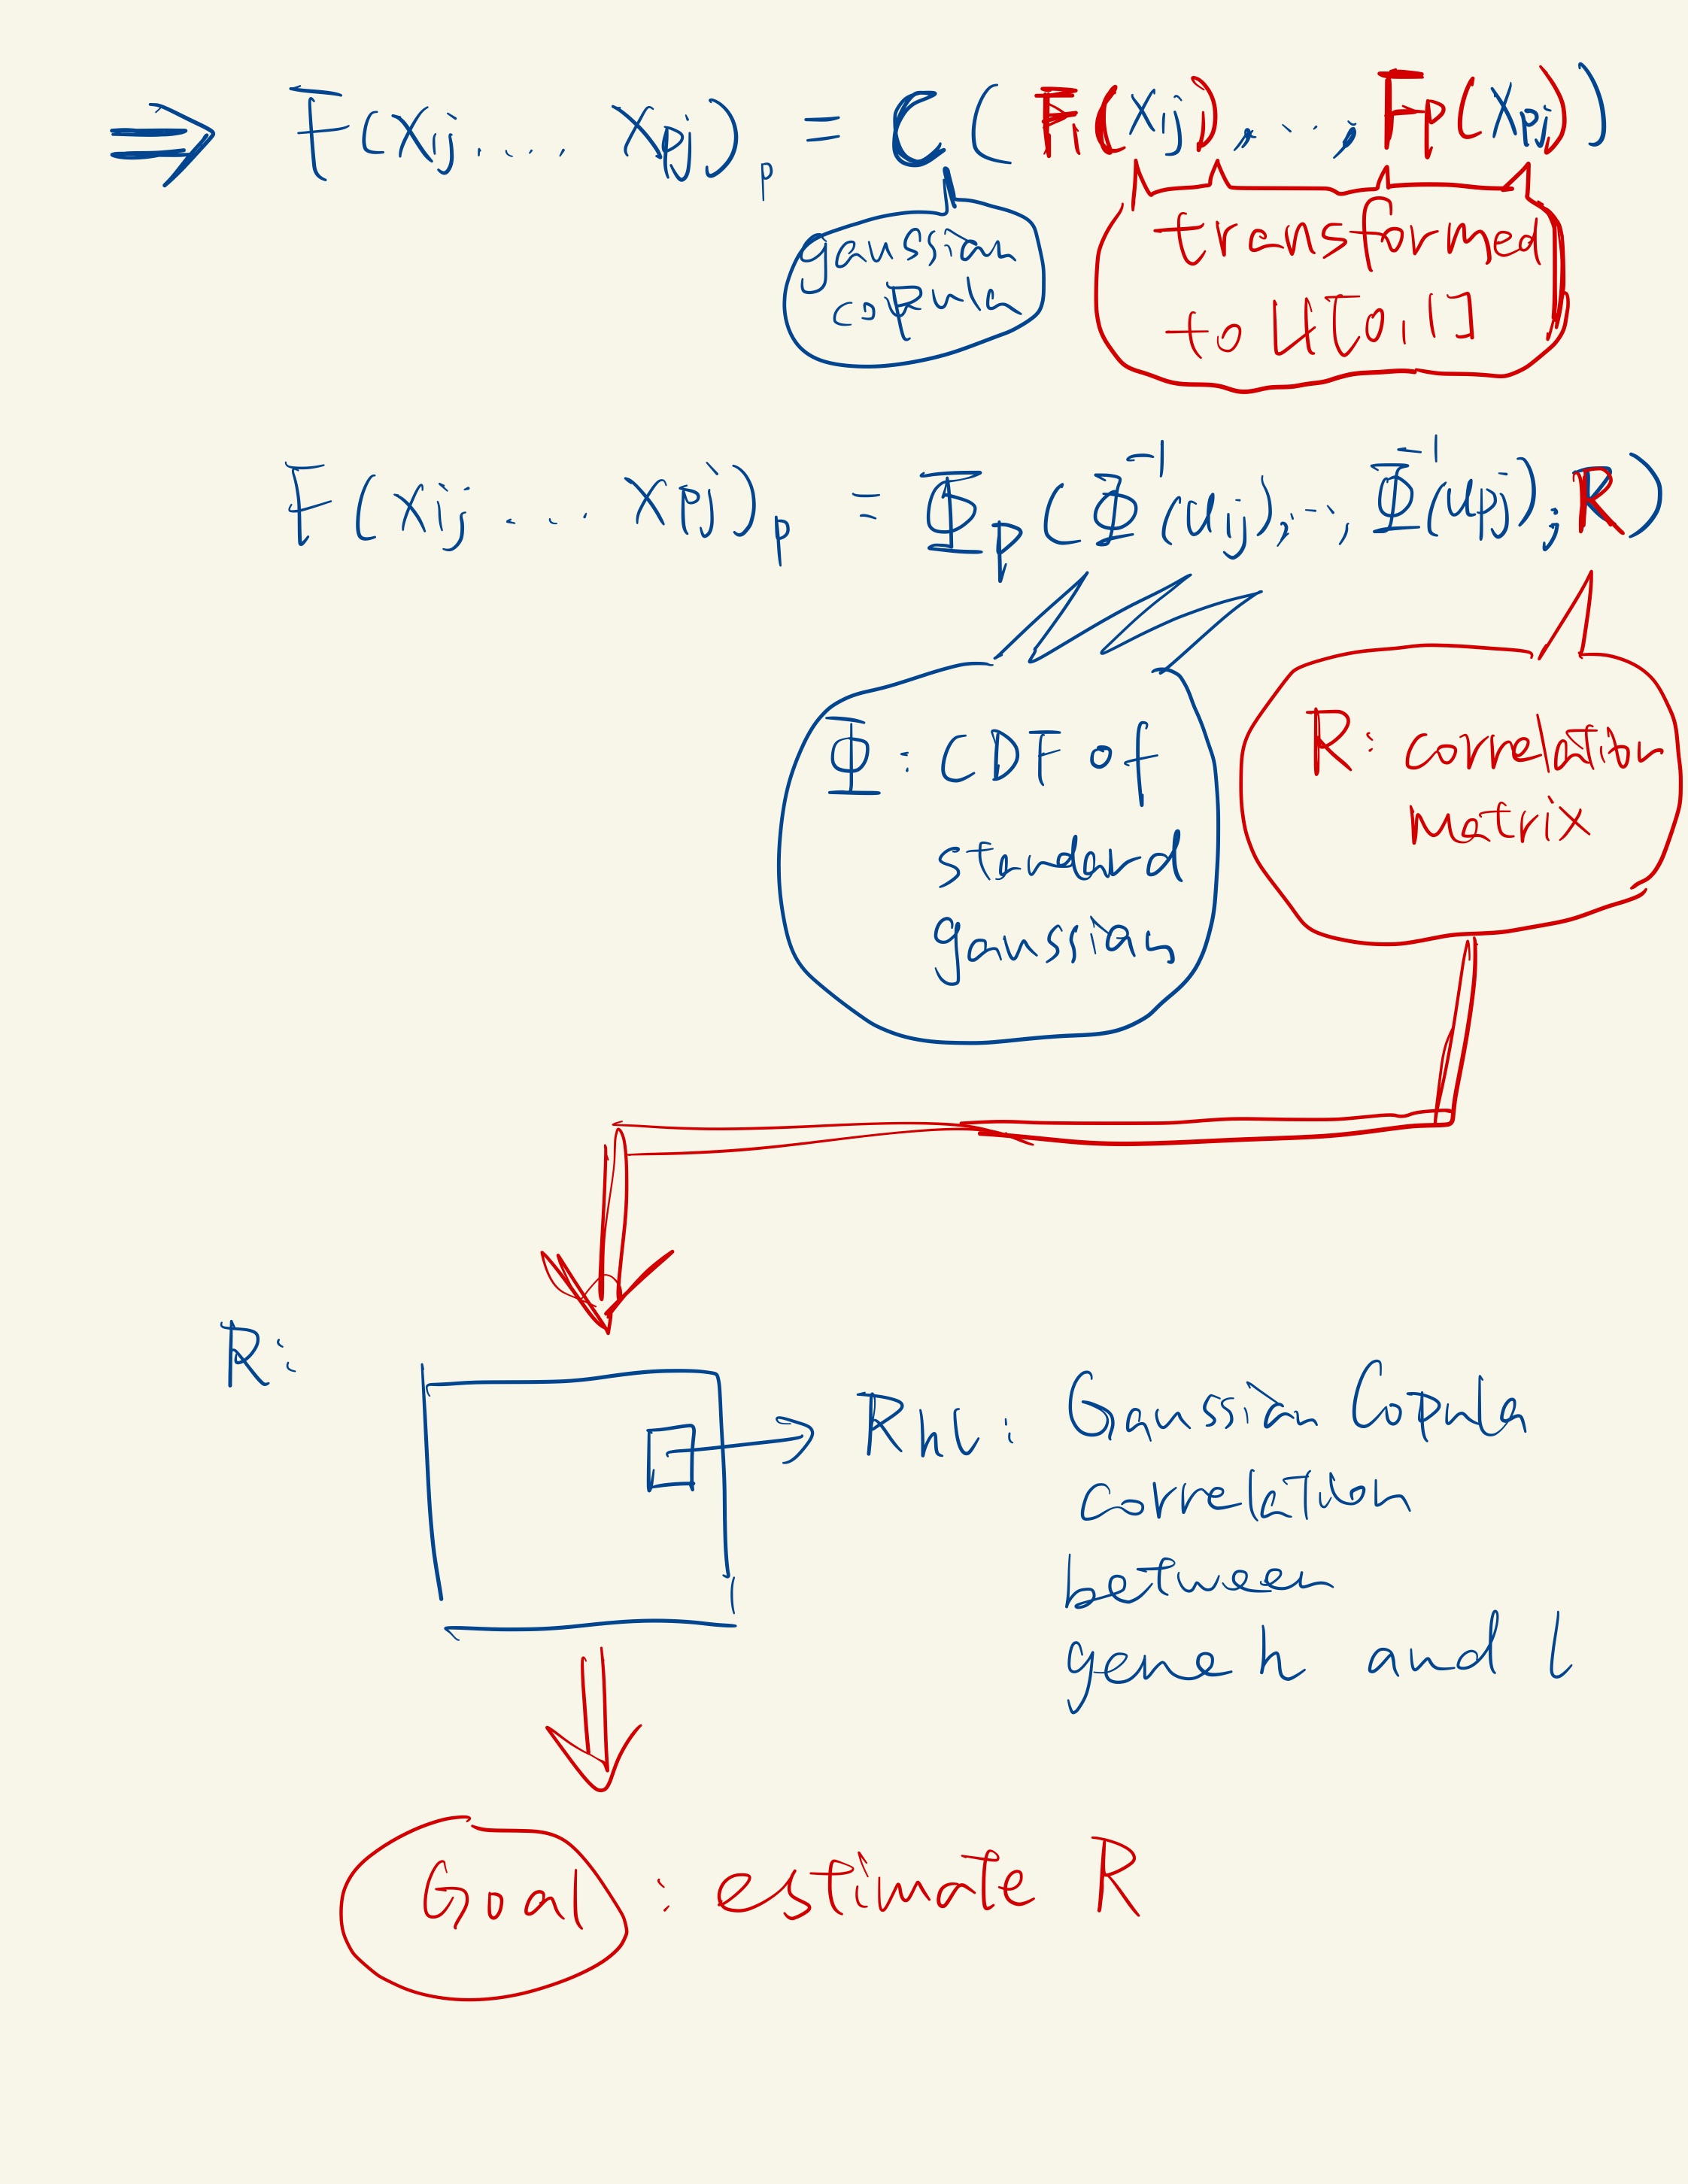
According to Sklar’s theorem, any multivariate joint distribution can be written in terms of univariate marginal distribution functions and a copula that describes the dependence structure between the variables.
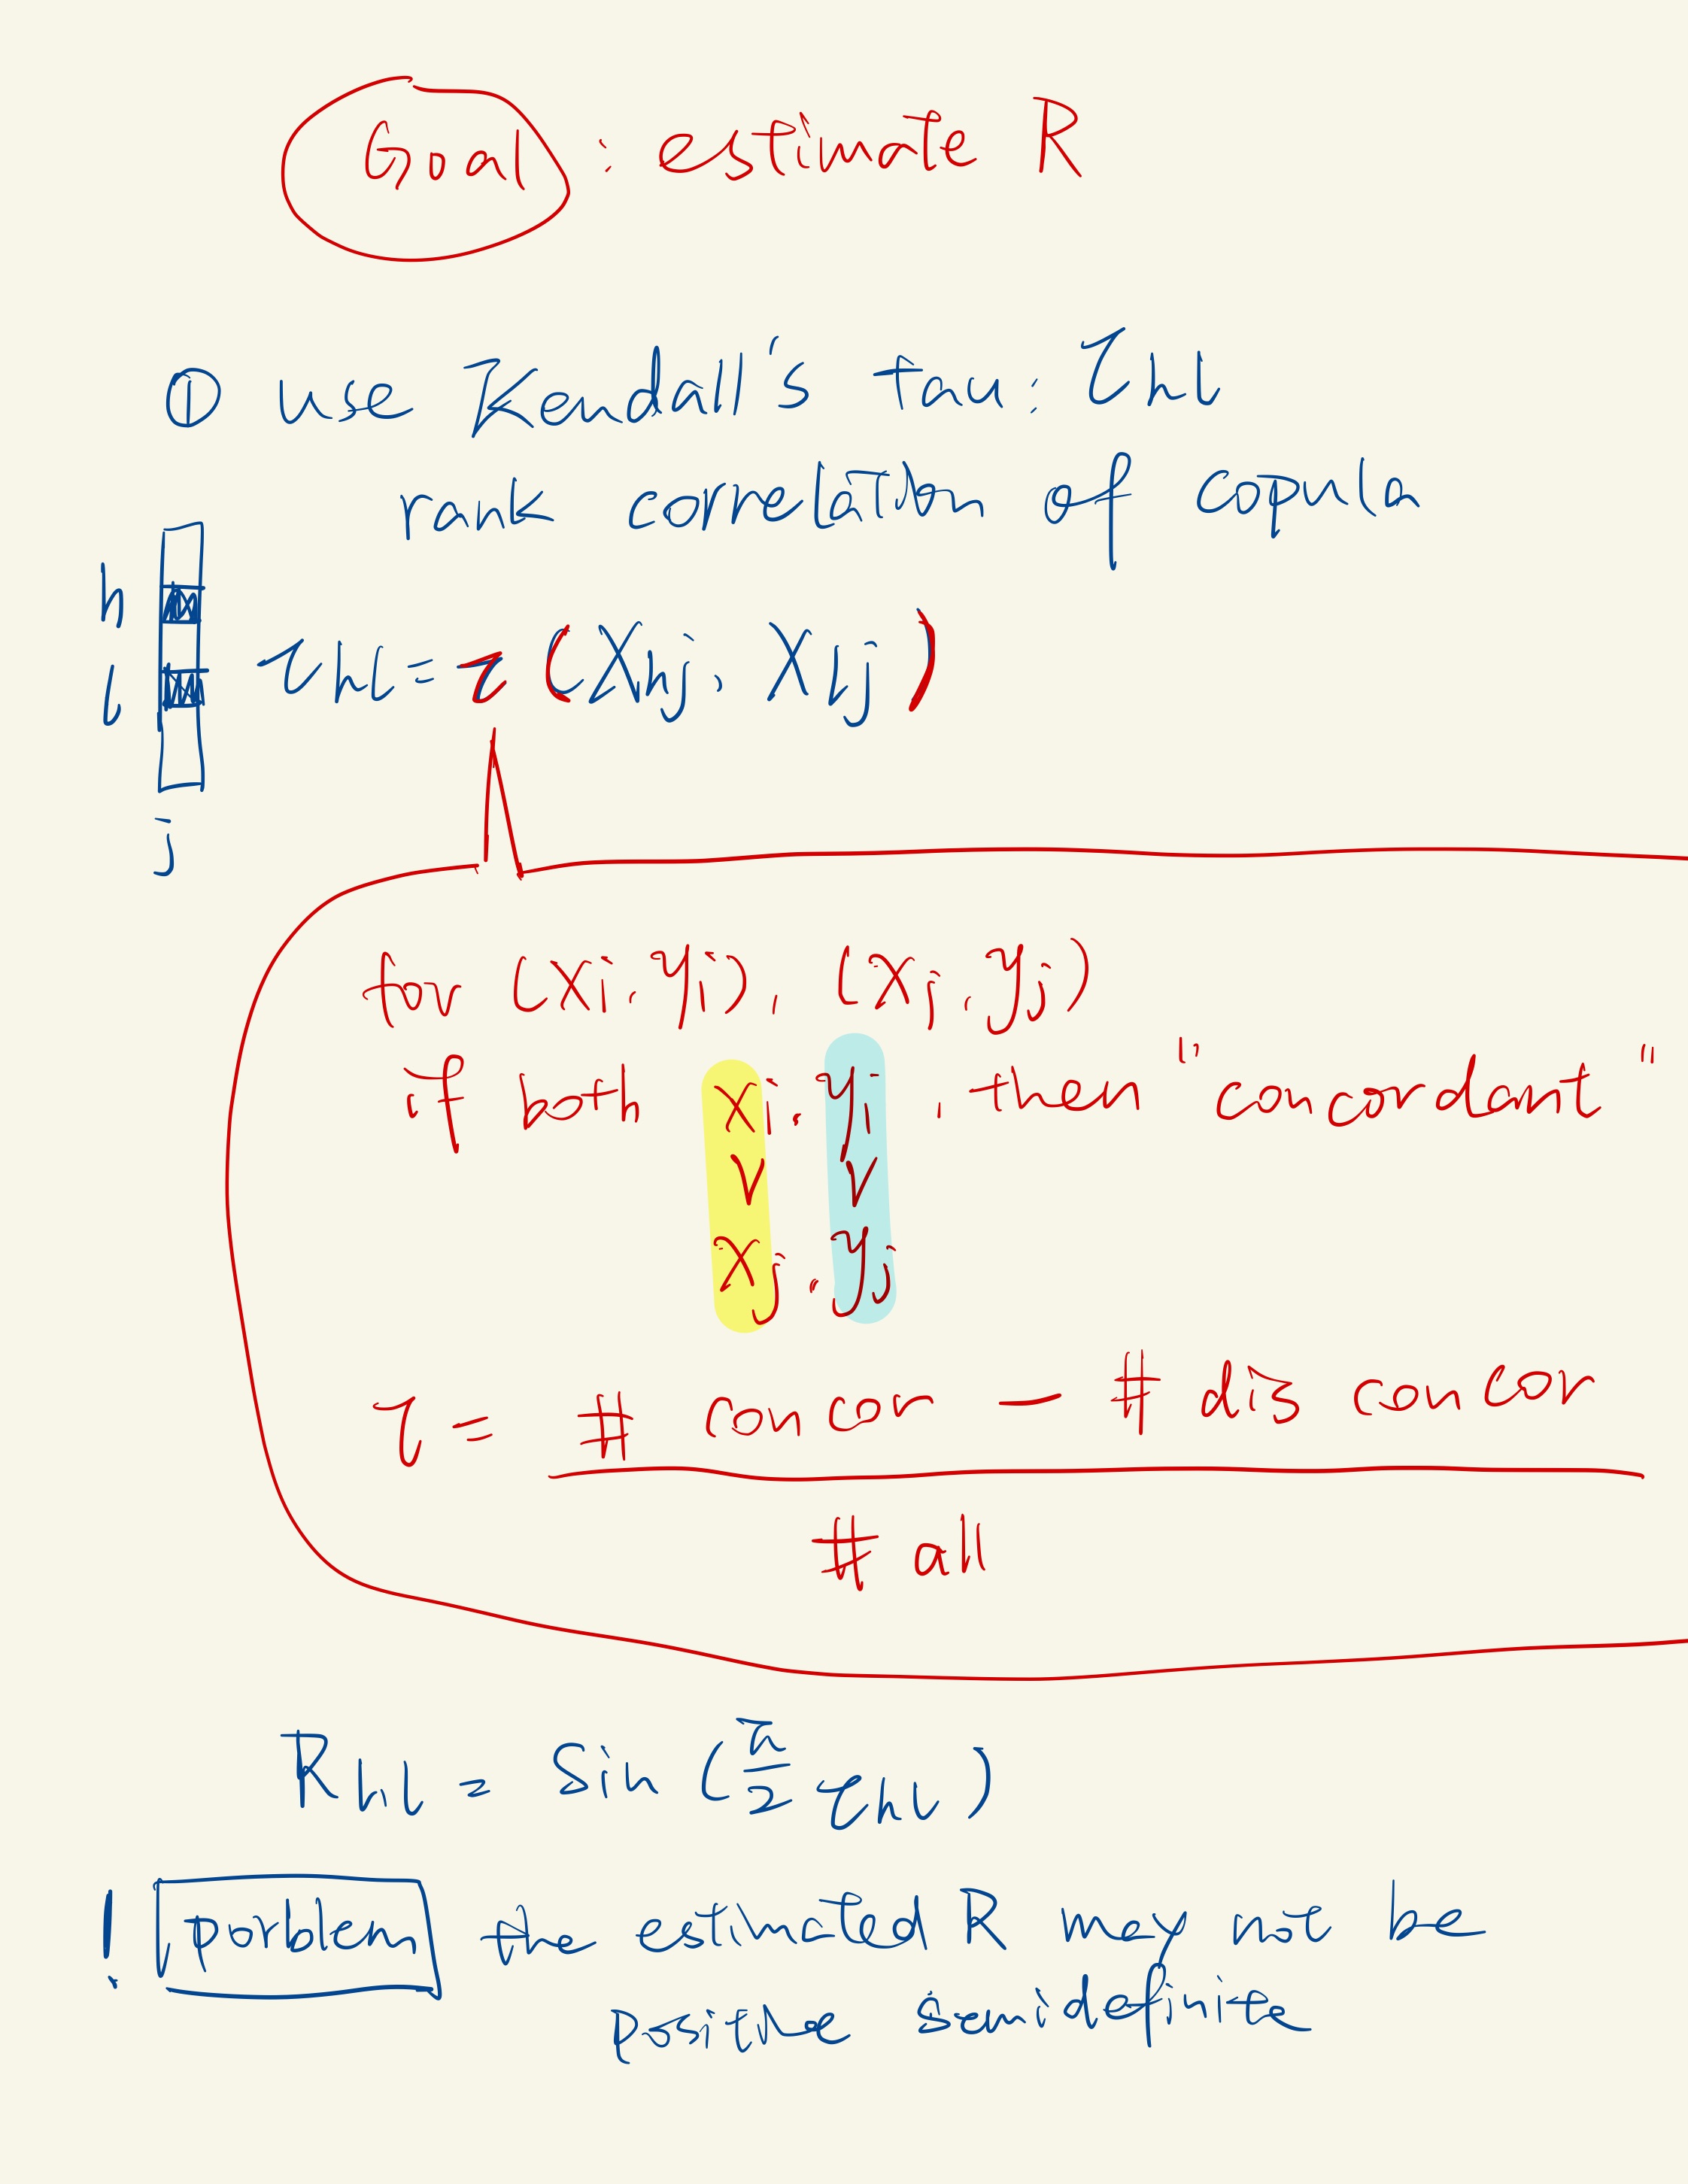
For joint r.v X and Y, if for any pair of observations(i i) and (j j) the sort order agrees, we call this pair to be concordant.
Methodology Overview
-
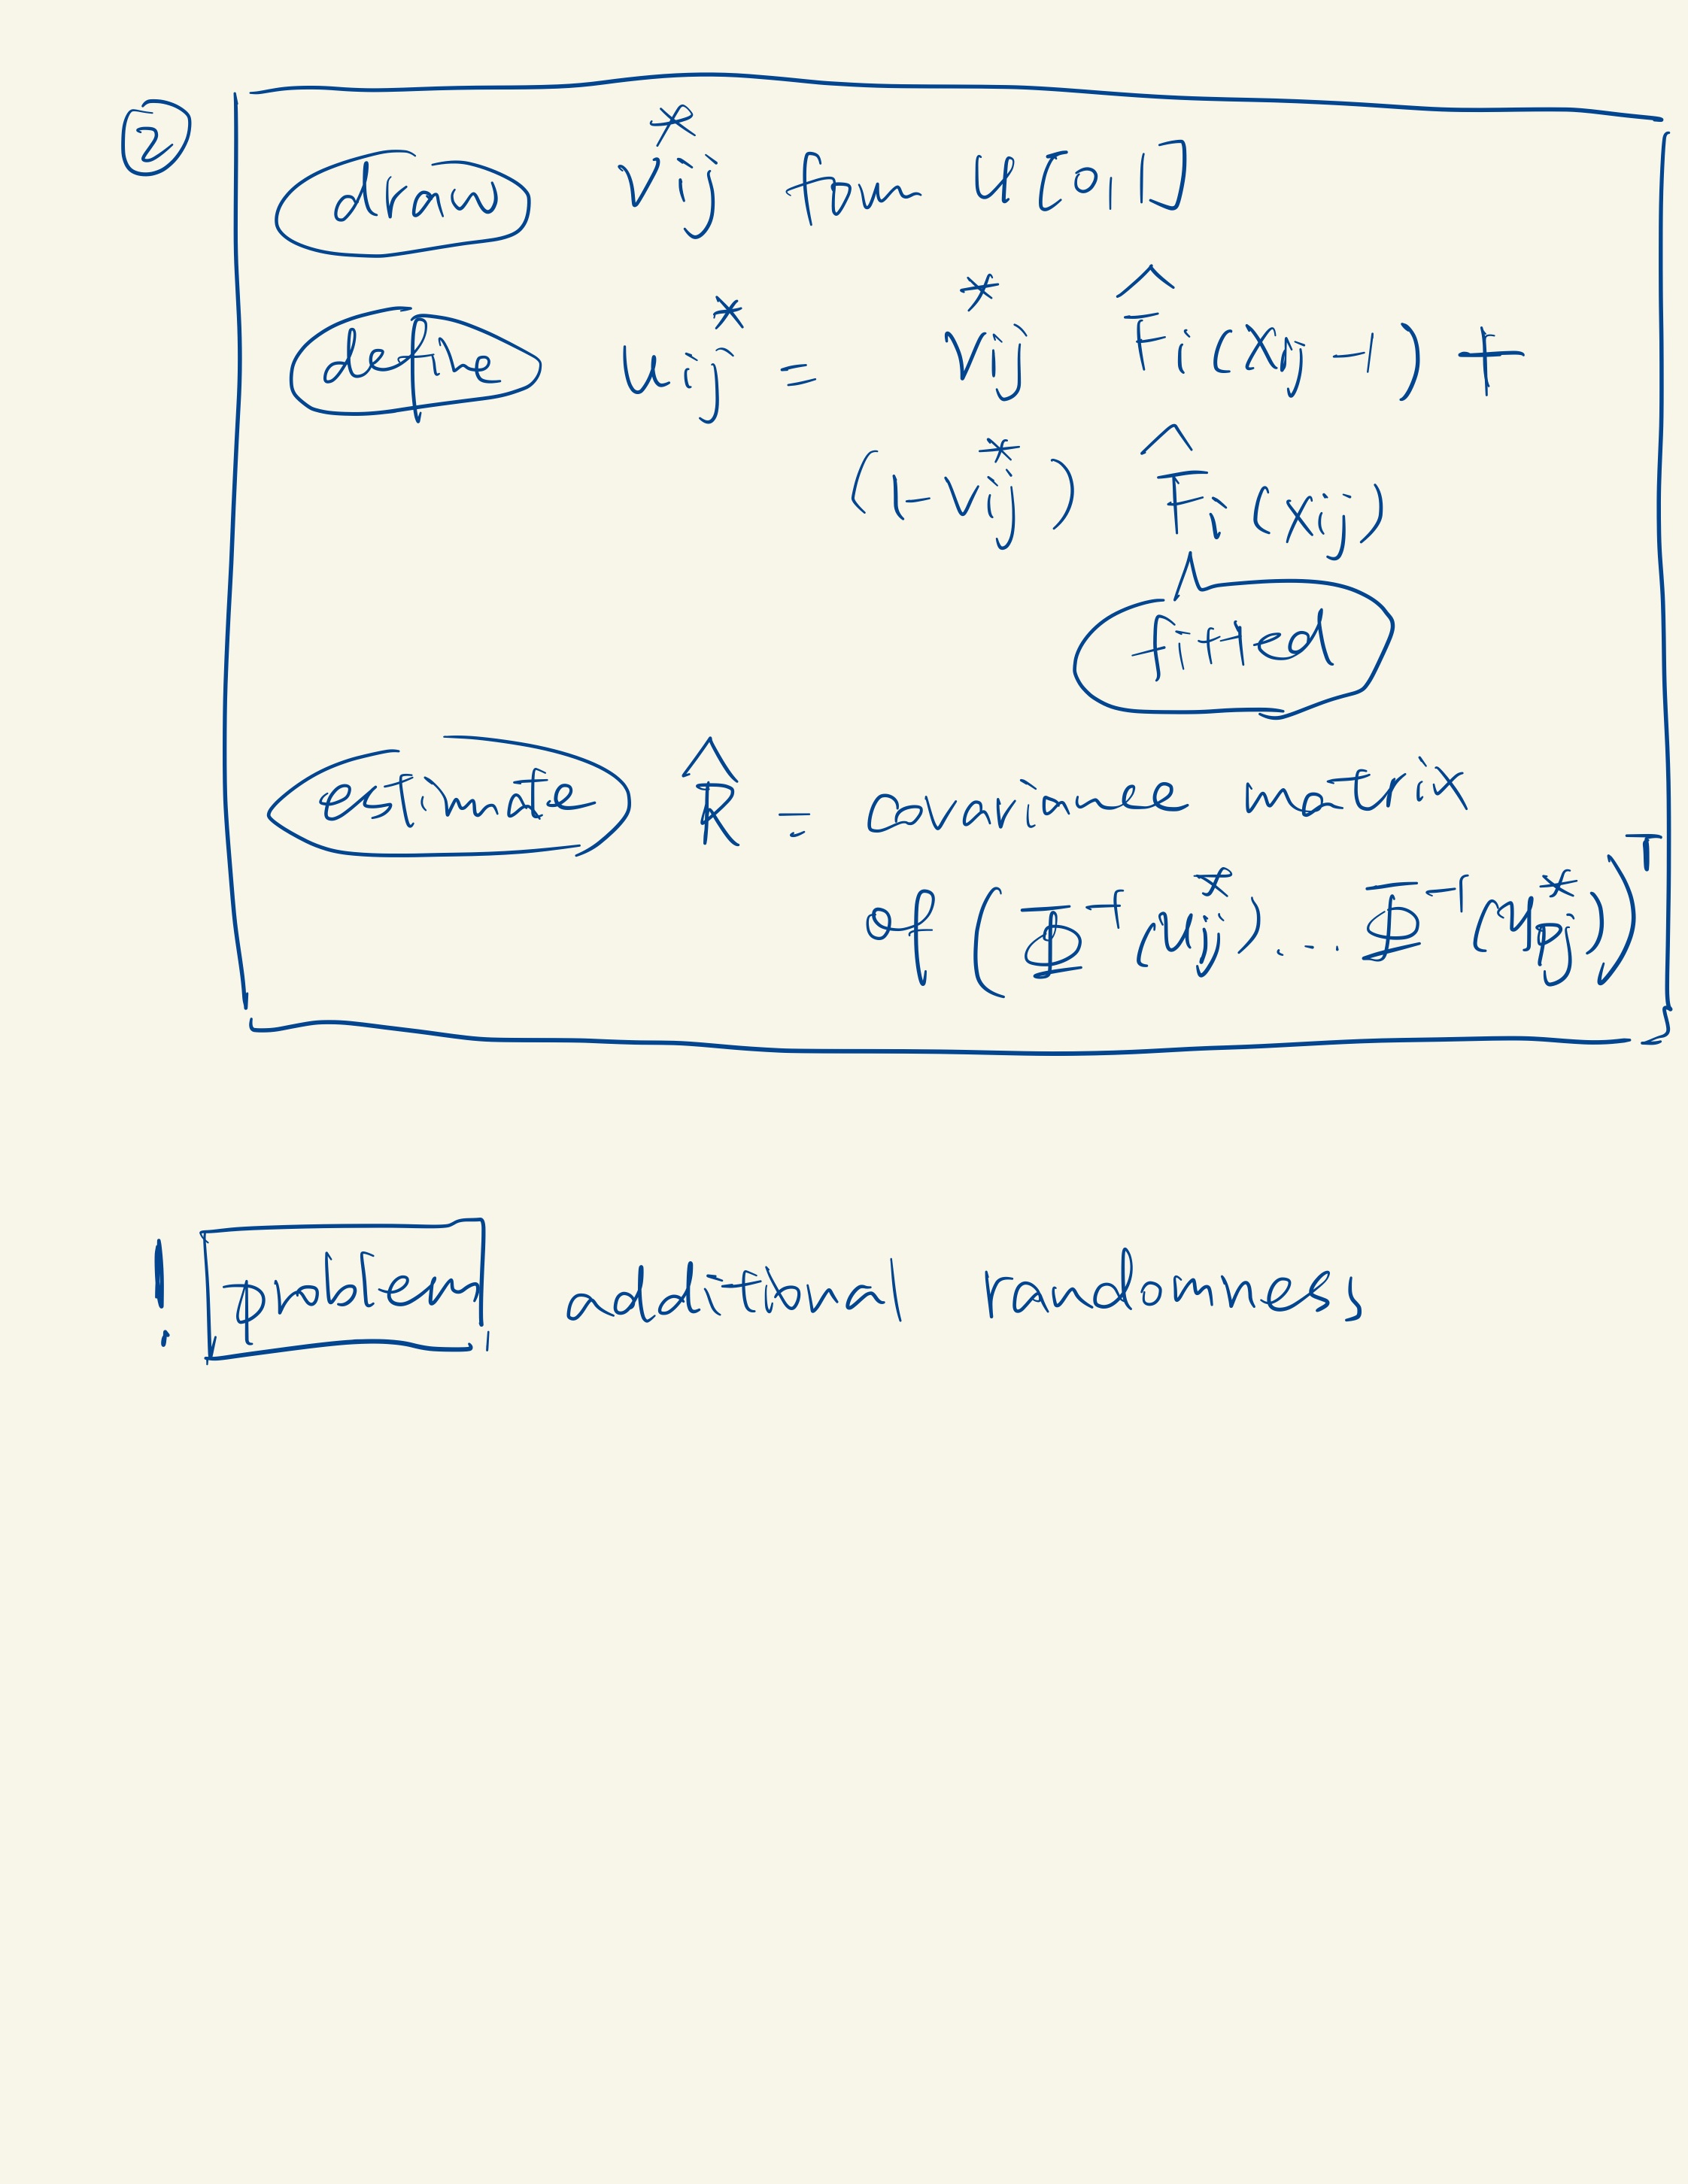
Univariate Count Distribution Fitting: In this first sub-step, scDesign2 fits a specific univariate count distribution to each gene’s counts in cells of the same type. It considers four count distributions: Poisson, zero-inflated Poisson (ZIP), negative binomial (NB), and zero-inflated negative binomial (ZINB). It selects the most appropriate distribution for each gene in each cell type based on the data.
-
Correlation Capture with Gaussian Copula: In the second sub-step, scDesign2 captures the correlations among thousands of genes by fitting a Gaussian copula within each cell type. The Gaussian copula is chosen for its ease of fitting and transparency, as it effectively captures gene correlations.
Limitations
Estimating copula correlations in single-cell RNA-seq data can be problematic when the number of cells is not large enough. Many genes in such data have very low expression levels, making it uninteresting to estimate their correlations. A practical approach is to focus on estimating copula correlations for a subset of genes that are moderately to highly express。