Make graph plot
make_the_graph.RdGenerate the graph for the dashboard.
Details
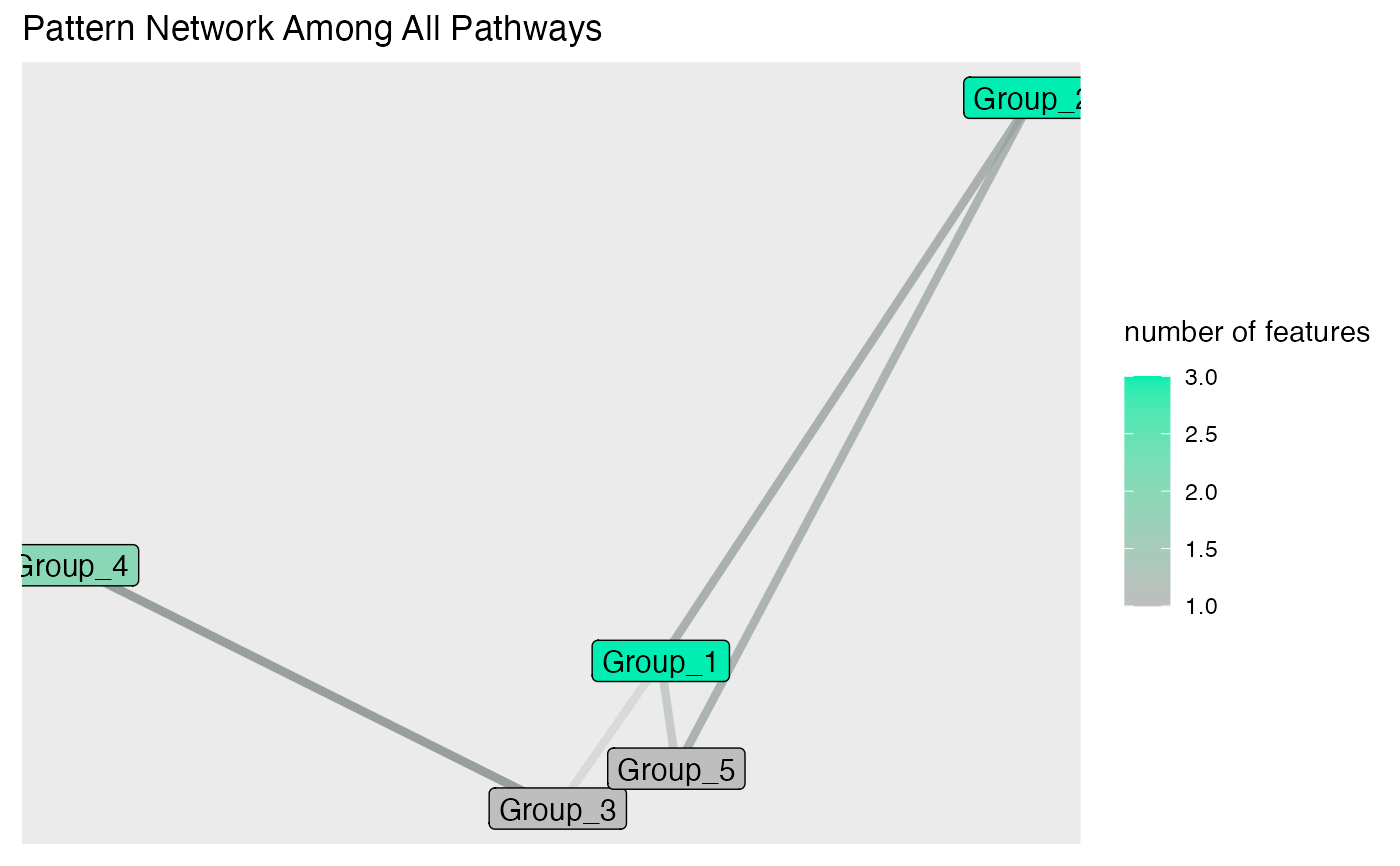
this function makes a network plot for every Pathway selection in the Shiny to show the relationship among clustered pattern groups.
The network plot is built by the dataset generated from gNetwork() and can be further adjusted with layout and minimum weights.
See also ggraph::ggraph.
Examples
data(test_data)
make_the_graph(test_graphptw, test_network, 0.03, "Muscular System","kk")
