Generate prediction network
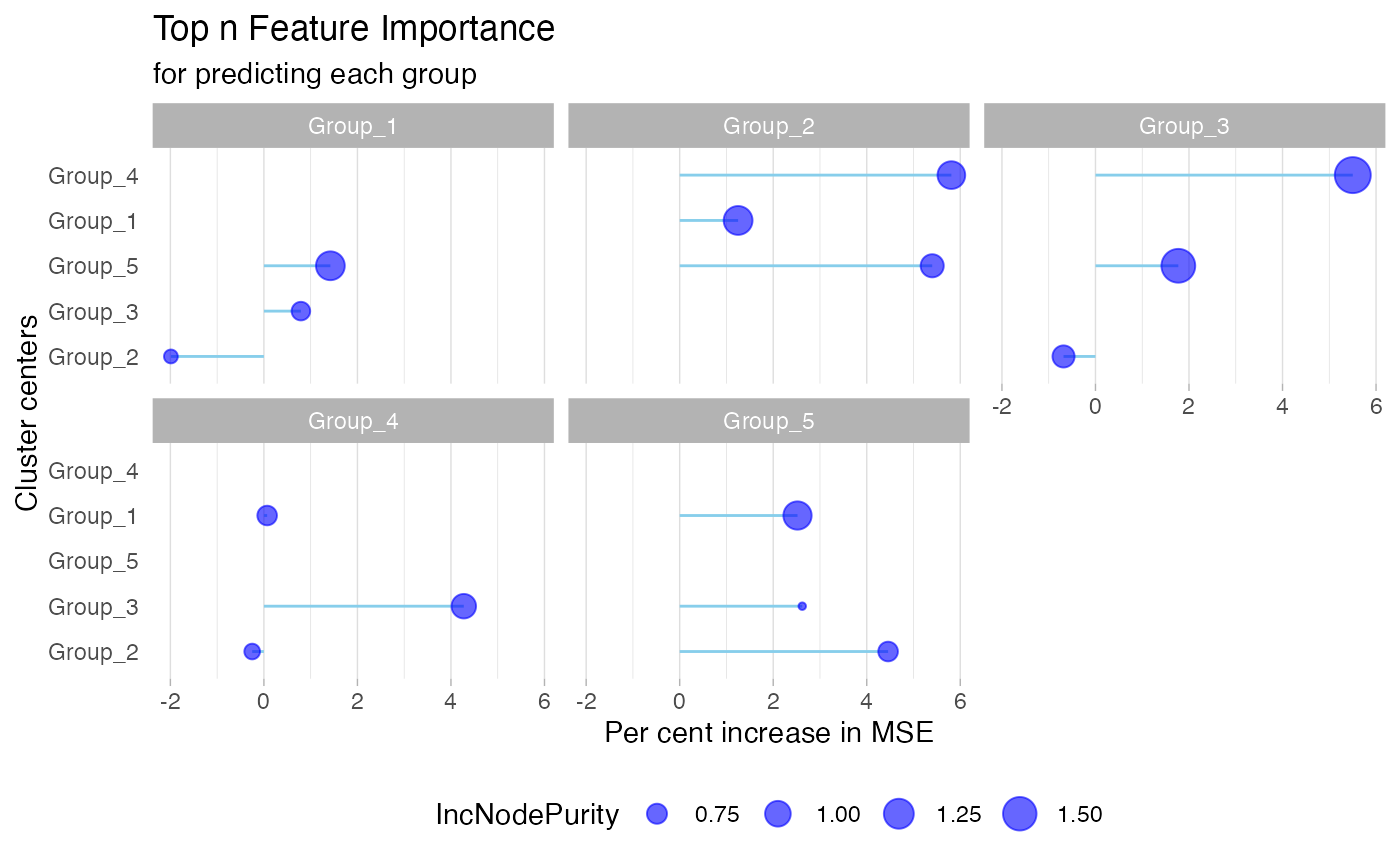
gNetwork.RdgNetwork() generates a prediction network for each functional annotation. For every feature, all other features are considered as independent variables, and the top predictors are selected based on %IncMSE.
Arguments
- clusters
A list of two outputs of
gClusters(). The first element is the k-means result (See alsostats::kmeans), while the other element is a plot and will be automatically omitted for ease of directly passing results to the function.- ntop
A number you pick to set the top n predictors(default: top 10) for each feature as the important ones. This will be used to construct the network among the clustered patterns.
- seed
A number of random seed.
Details
We assess relationships between clusters using Mean Squared Error (MSE) changes resulting from random shuffling. gNetwork()'s output includes edge weights and node pairs, which are essential inputs for the dashboard.
Examples
data(test_data)
networkres <- gNetwork(test_cluster, ntop = 3)
head(networkres)
#>       weight IncNodePurity var_names    from
#> 1  1.4215243     1.1776012   Group_5 Group_1
#> 2  0.7911266     0.7011049   Group_3 Group_1
#> 3 -1.9891284     0.5811186   Group_2 Group_1
#> 4  5.8098014     1.1107592   Group_4 Group_2
#> 5  5.4000389     0.8744358   Group_5 Group_2
#> 6  1.2492288     1.1816976   Group_1 Group_2
gNetwork_view(networkres)
