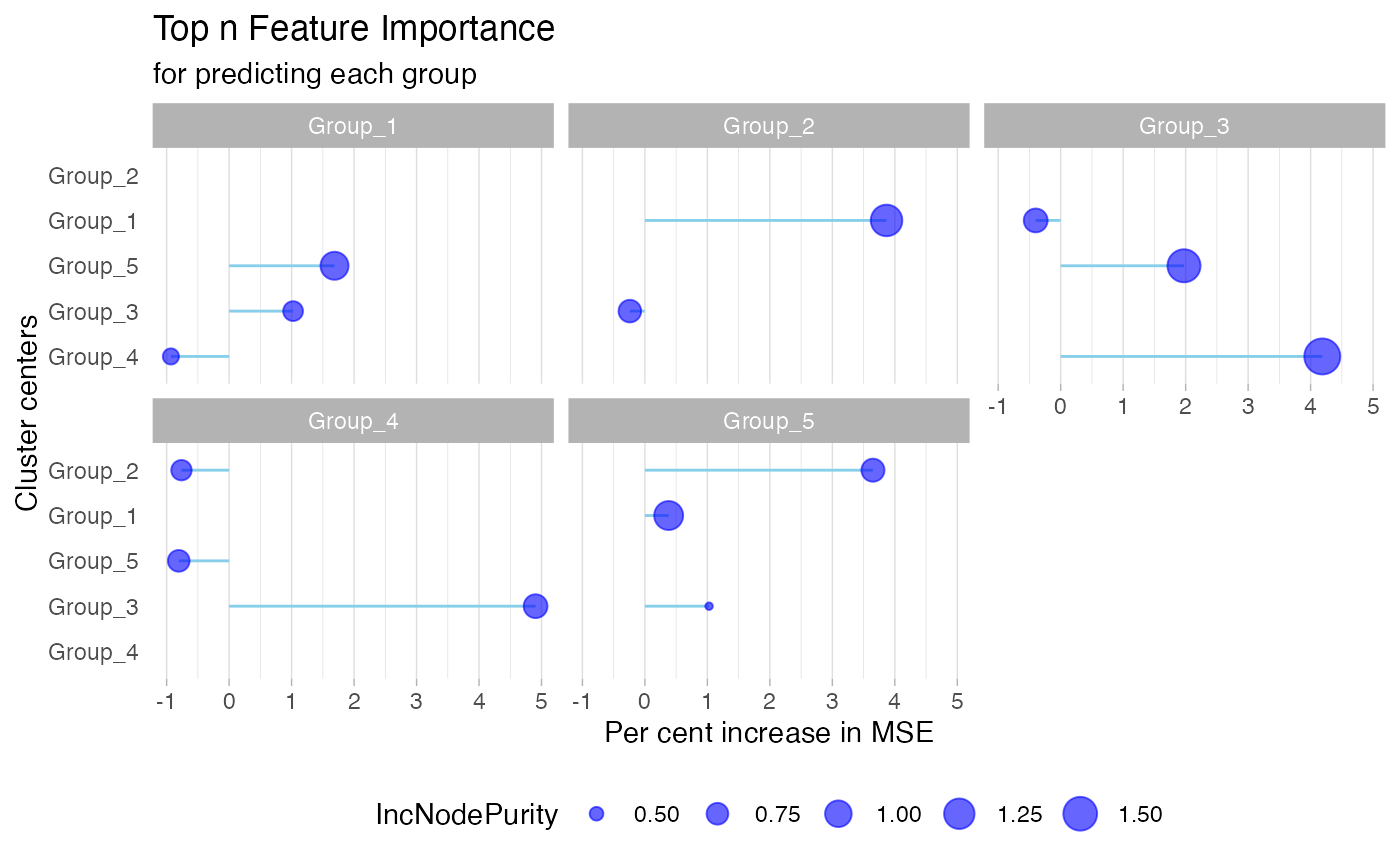
View the feature importance plot
gNetwork_view.RdgNetwork_view() Generate a feature importance plot for the random forest result. This plot visually highlights the importance of individual cluster within a dataset, helping to identify key factors in predictive modeling.
Arguments
- data
A dataframe; The output of
gNetwork(), including 4 variables:weight,IncNodePurity,var_namesandfrom. The weight is the edge value, the IncNodePurity(%IncMSE) is the measure of predictions as a result ofvar_namesbeing permuted.fromis the dependent variable in each round of random forest.
Examples
data(test_data)
gNetwork_view(test_network)
#> Warning: Removed 1 rows containing missing values (`geom_segment()`).
#> Warning: Removed 1 rows containing missing values (`geom_point()`).
