An R-Shiny Package for Cluster Co-Expression Analysis in Longitudinal Microbiomics
Overview
MolPad offers a visualization dashboard tool designed to enhance our understanding of how molecular co-expression works in the context of microbiome data. The approach involves using a cluster network to provide an initial overview of relationships across multiple omics, with the added functionality to interactively zoom in on specific areas of interest. To facilitate this analysis, we’ve developed a focus-plus-context strategy that connects to online curated annotations.
Additionally, our package simplifies the entire pipeline for creating the dashboard. This user-friendly design makes it accessible even to people with limited R programming experience. Check out our cheese-data demo here.
Installation
You can either install it with devtools, {r, eval = FALSE} # Install the package in R: install.packages("devtools") library(devtools) install_github("KaiyanM/MolPad") or clone this repository to your local computer (for example, onto ./Github) for installing: {r, eval = FALSE} # Download and install the package in R: setwd("./GitHub") install("MolPad") after that, load the package: {r,eval=FALSE} library(MolPad)
Usage
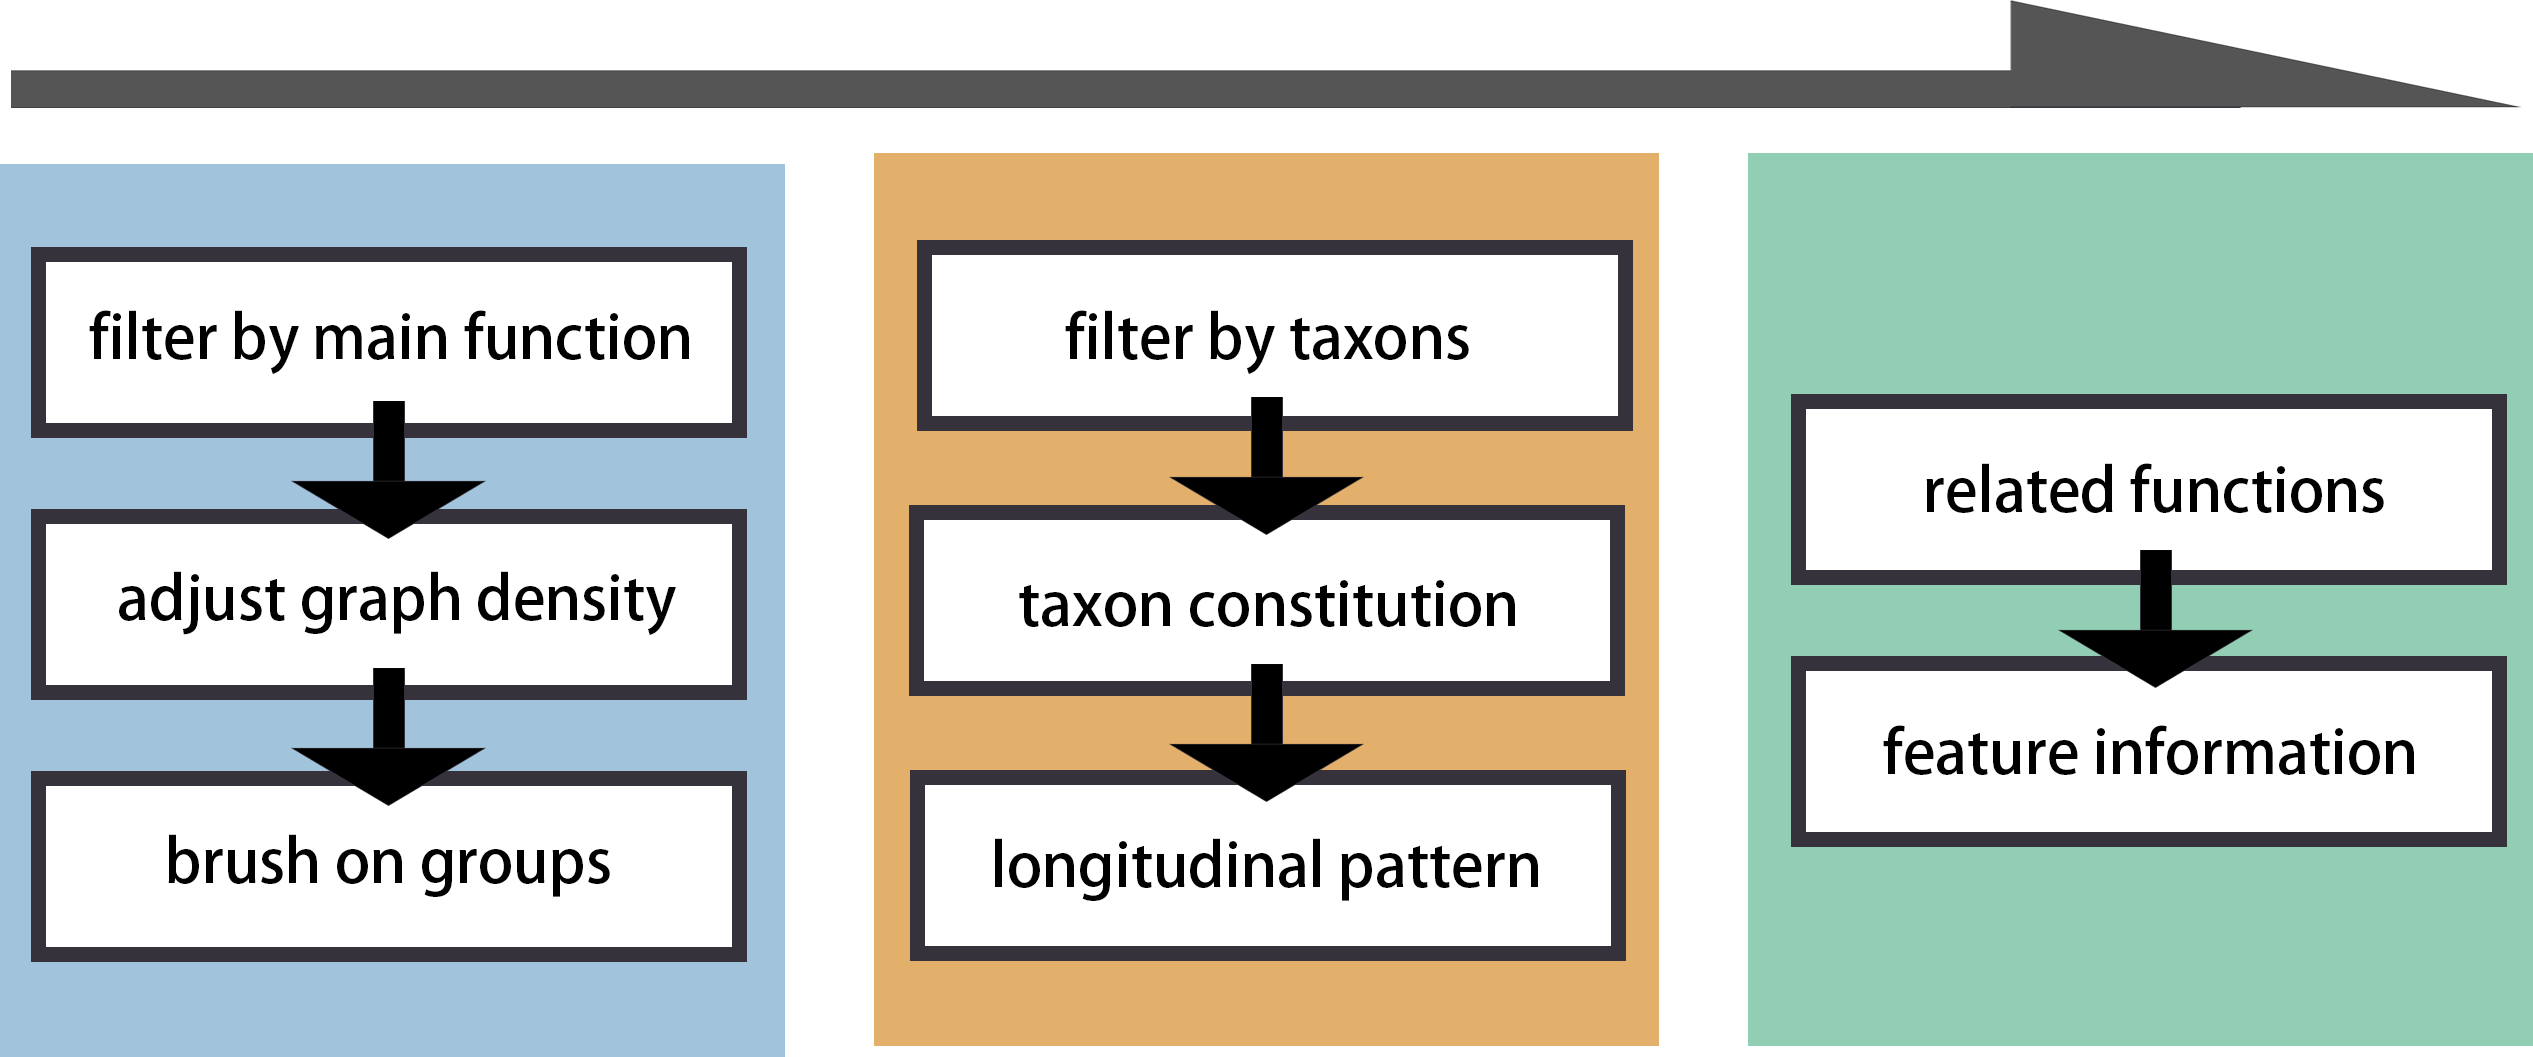
MolPad could help you with:
- Clustering the data with k-means and building a group network.
- Find the significant trend patterns in your datasets.
- Target the interaction between groups, taxons, and pathways.
- Visualize the distribution of features in specific pathways on the group network.
- Search for particular features and other user-defined labels.
- Check detailed information on each feature through automatically generated hyperlinks.
- Have a better overall understanding of the datasets.
Getting Help
If you need assistance with MolPad, there are two primary ways to seek help:
- Ask us about anything related to MolPad! To add your question, create an issue in this repository.
- Stack Overflow is another excellent resource for answering common issues in R.
Remember that it’s particularly effective when you can provide a reproducible example that shows the specific problem you’re having.