Make stackbar plot
make_stackbar_plot.RdGenerate the stackbar plot for the dashboard.
Details
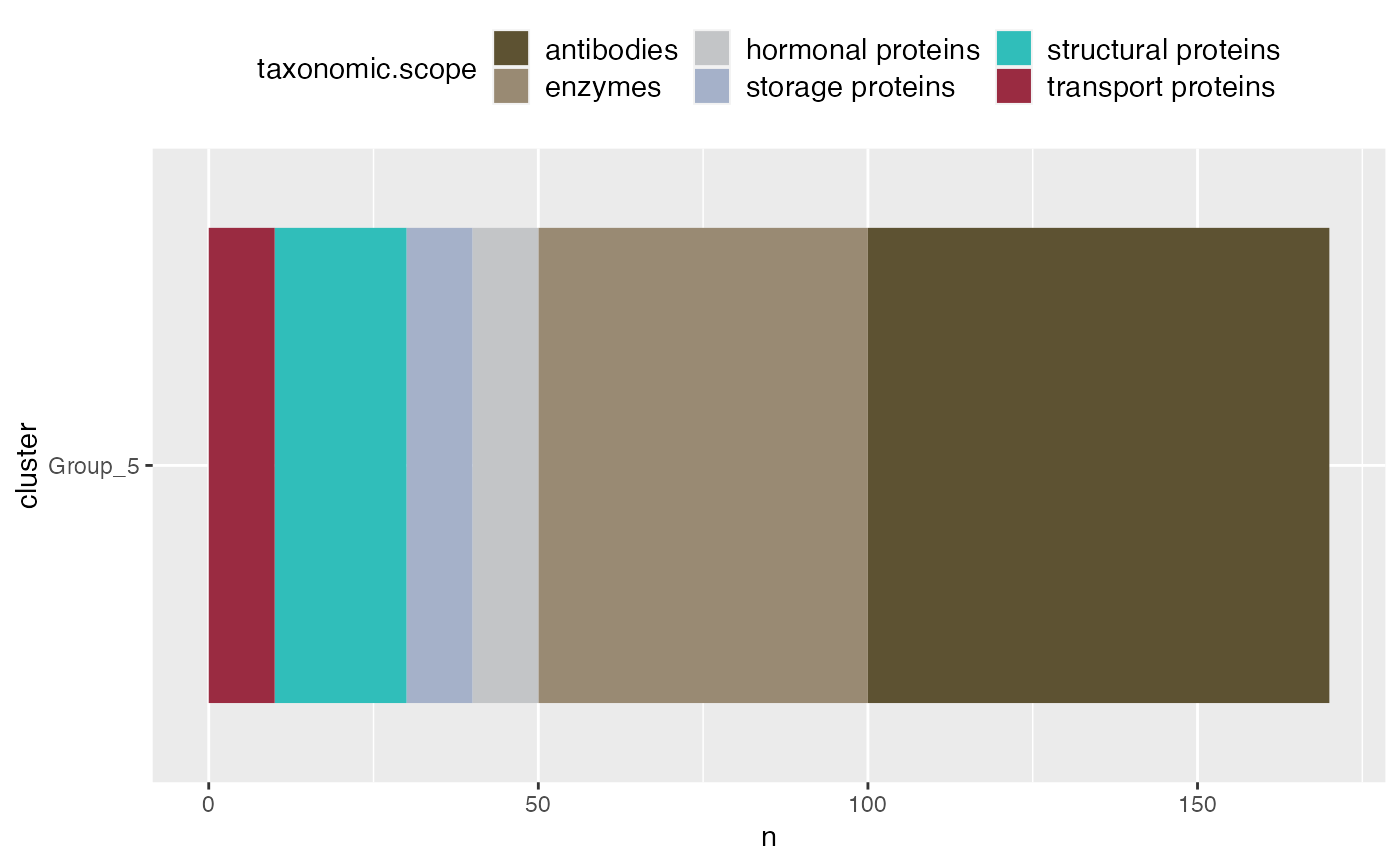
this function makes a bar plot for every brush action in the Shiny to show the components of each clustered pattern group. The bar plot is colored by the taxonomic.scope variable in the processed annotation dataset generated from gAnnotation().
See also ggplot2::geom_bar.